30
/
AIzaSyAYiBZKx7MnpbEhh9jyipgxe19OcubqV5w
April 1, 2024
261719
Tanzania
TZA
true
2
1
Trademark applications, direct nonresident
2008,2007,2006,2005,2004,2003,2002,2001,2000,1999,1990,1989,1983,1981,1980,1978,1977,1975,1973,1968,1966,1965,1964,1963,1962
Download
Global statistics library →Tanzania →

Trademark applications, direct nonresident

This statistics in other country:

AlbaniaAlgeriaAndorraAngolaAntigua and BarbudaArab WorldArgentinaArmeniaArubaAustraliaAustriaAzerbaijanBahamas, TheBahrainBangladeshBarbadosBelarusBelgiumBelizeBhutanBoliviaBosnia and HerzegovinaBotswanaBrazilBrunei DarussalamBulgariaBurundiCambodiaCanadaCaribbean small statesCentral Europe and the BalticsChileChinaColombiaCongo, Dem. Rep.Costa RicaCroatiaCubaCuracaoCyprusCzech RepublicDenmarkDjiboutiDominicaDominican RepublicEarly-demographic dividendEast Asia & PacificEast Asia & Pacific (excluding high income)East Asia & Pacific (IDA & IBRD countries)EcuadorEgypt, Arab Rep.El SalvadorEstoniaEthiopiaEuro areaEurope & Central AsiaEurope & Central Asia (excluding high income)Europe & Central Asia (IDA & IBRD countries)European UnionFijiFinlandFranceGambia, TheGeorgiaGermanyGhanaGreeceGrenadaGuatemalaGuyanaHaitiHigh incomeHondurasHong Kong SAR, ChinaHungaryIBRD onlyIcelandIDA & IBRD totalIDA blendIndiaIndonesiaIran, Islamic Rep.IraqIrelandIsraelItalyJamaicaJapanJordanKazakhstanKenyaKiribatiKorea, Dem. People’s Rep.Korea, Rep.KuwaitKyrgyz RepublicLao PDRLate-demographic dividendLatin America & Caribbean Latin America & Caribbean (excluding high income)Latin America & the Caribbean (IDA & IBRD countries)LatviaLebanonLesothoLiberiaLibyaLiechtensteinLithuaniaLow & middle incomeLower middle incomeLuxembourgMacao SAR, ChinaMacedonia, FYRMadagascarMalawiMalaysiaMaliMaltaMauritiusMexicoMiddle East & North AfricaMiddle East & North Africa (excluding high income)Middle East & North Africa (IDA & IBRD countries)Middle incomeMoldovaMonacoMongoliaMontenegroMoroccoMozambiqueMyanmarNamibiaNepalNetherlandsNew ZealandNicaraguaNigeriaNorth AmericaNorwayOECD membersOmanOther small statesPacific island small statesPakistanPanamaPapua New GuineaParaguayPeruPhilippinesPolandPortugalPost-demographic dividendQatarRomaniaRussian FederationRwandaSamoaSan MarinoSao Tome and PrincipeSaudi ArabiaSerbiaSeychellesSierra LeoneSingaporeSint Maarten (Dutch part)Slovak RepublicSloveniaSmall statesSolomon IslandsSomaliaSouth AfricaSouth AsiaSouth Asia (IDA & IBRD)SpainSri LankaSt. LuciaSt. Vincent and the GrenadinesSudanSurinameSwazilandSwedenSwitzerlandSyrian Arab RepublicTajikistanTanzaniaThailandTongaTrinidad and TobagoTunisiaTurkeyTurkmenistanTuvaluUgandaUkraineUnited Arab EmiratesUnited KingdomUnited StatesUpper middle incomeUruguayUzbekistanVenezuela, RBVietnamWorldYemen, Rep.ZambiaZimbabwe

Timeline:

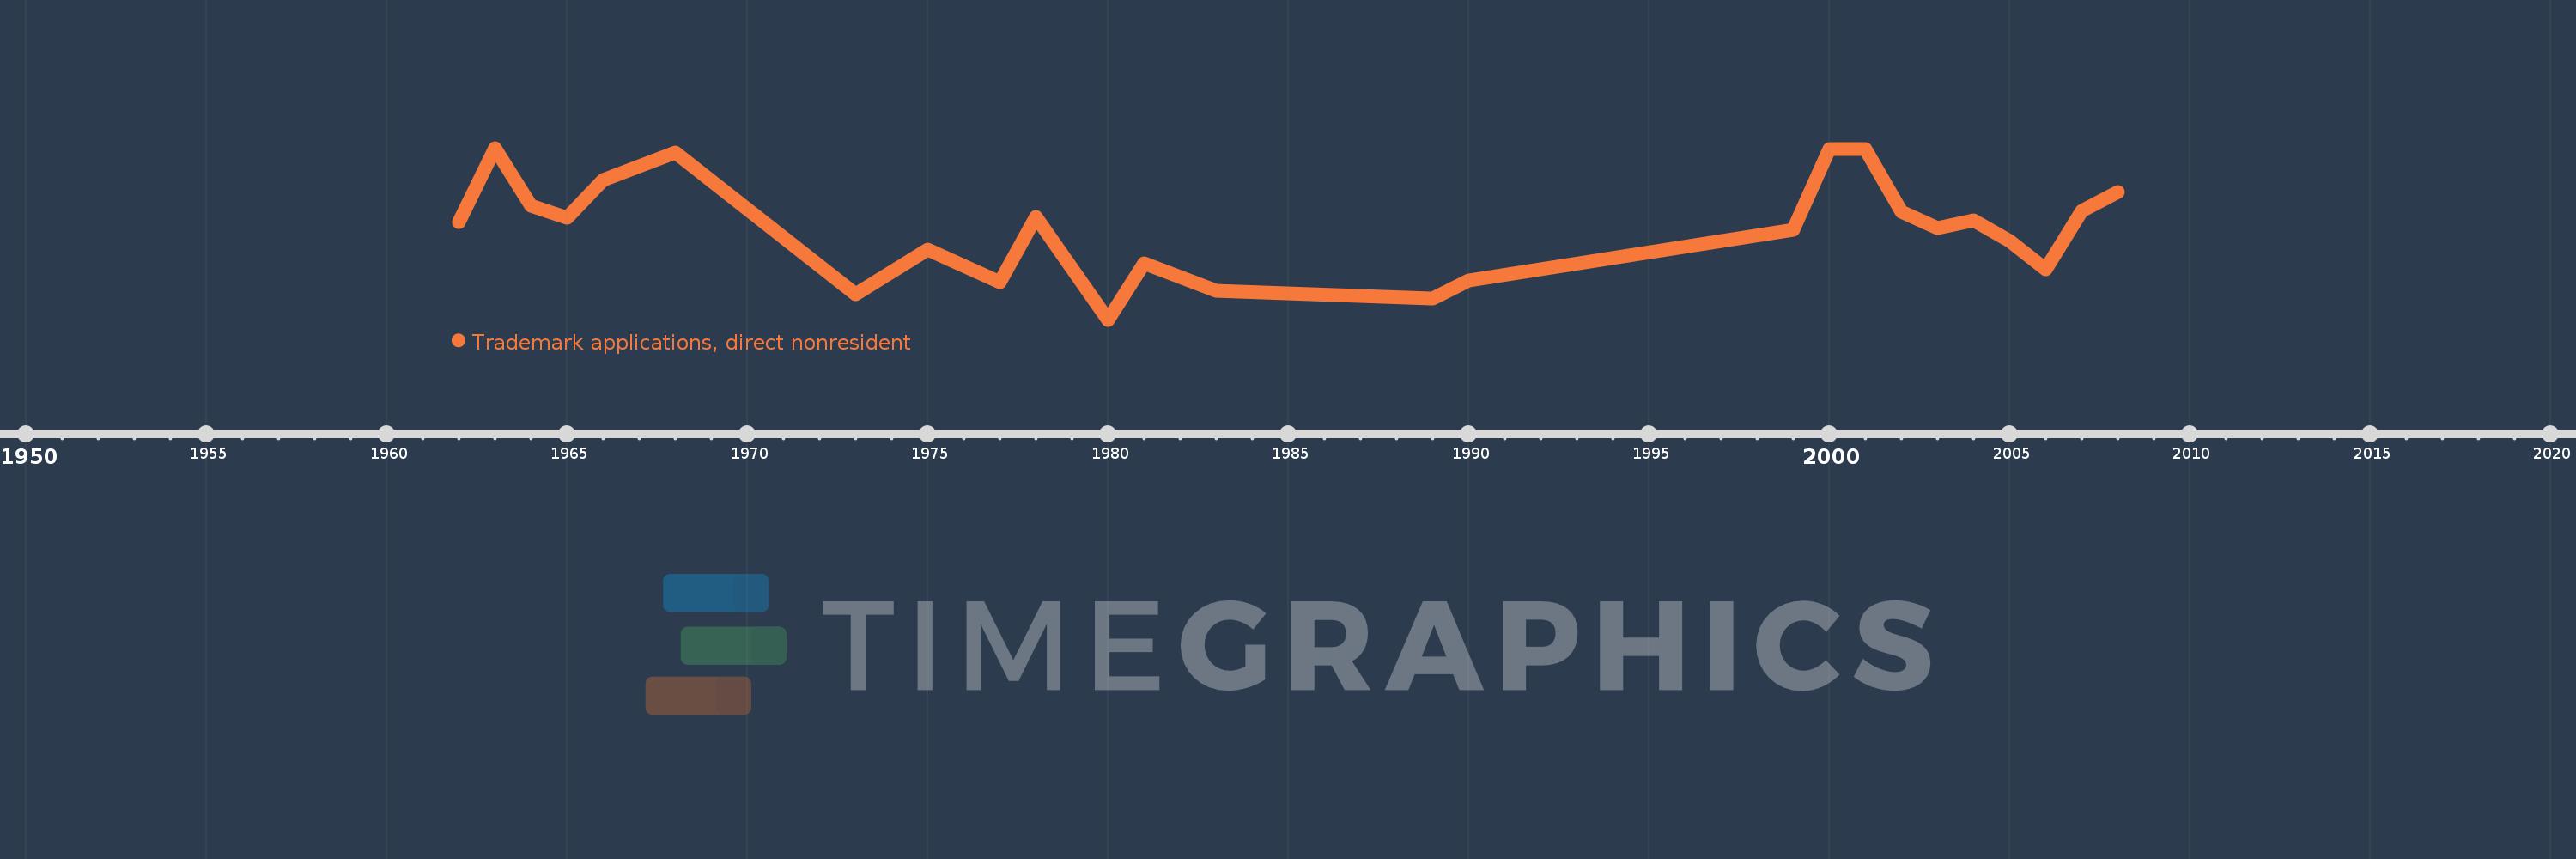
This timeline shows a graph from 1962 to 2008 of Tanzania. No data until 1961. Number of actual observations by date: 25.

Source name:

World Development Indicators

Source organization:

World Intellectual Property Organization (WIPO), WIPO Patent Report: Statistics on Worldwide Patent Activity. The International Bureau of WIPO assumes no responsibility with respect to the transformation of these data.

Categories, topics:

Science & Technology

Last updated:

apr 23, 2017

Indicators value changes by year

Meaning:
413.6
Minimum:
178.0
jan 1, 1980
Maximum:
624.0
jan 1, 1963
At the date of observation
Value
Absolute change
Change from the previous value
jan 1, 1962
431.0
+431.0
0.0%
jan 1, 1963
624.0
+193.0
44.78%
jan 1, 1964
474.0
-150.0
-24.04%
jan 1, 1965
443.0
-31.0
-6.54%
jan 1, 1966
540.0
+97.0
21.9%
jan 1, 1968
612.0
+72.0
13.33%
jan 1, 1973
244.0
-368.0
-60.13%
jan 1, 1975
360.0
+116.0
47.54%
jan 1, 1977
275.0
-85.0
-23.61%
jan 1, 1978
444.0
+169.0
61.45%
jan 1, 1980
178.0
-266.0
-59.91%
jan 1, 1981
324.0
+146.0
82.02%
jan 1, 1983
254.0
-70.0
-21.6%
jan 1, 1989
234.0
-20.0
-7.87%
jan 1, 1990
279.0
+45.0
19.23%
jan 1, 1999
412.0
+133.0
47.67%
jan 1, 2000
620.0
+208.0
50.49%
jan 1, 2001
620.0
0.0
0.0%
jan 1, 2002
459.0
-161.0
-25.97%
jan 1, 2003
415.0
-44.0
-9.59%
jan 1, 2004
436.0
+21.0
5.06%
jan 1, 2005
382.0
-54.0
-12.39%
jan 1, 2006
310.0
-72.0
-18.85%
jan 1, 2007
461.0
+151.0
48.71%
jan 1, 2008
509.0
+48.0
10.41%

Ranking of countries by current statistics by years