29
/
en
AIzaSyAYiBZKx7MnpbEhh9jyipgxe19OcubqV5w
April 1, 2024
263096
Thailand
THA
true
2
1
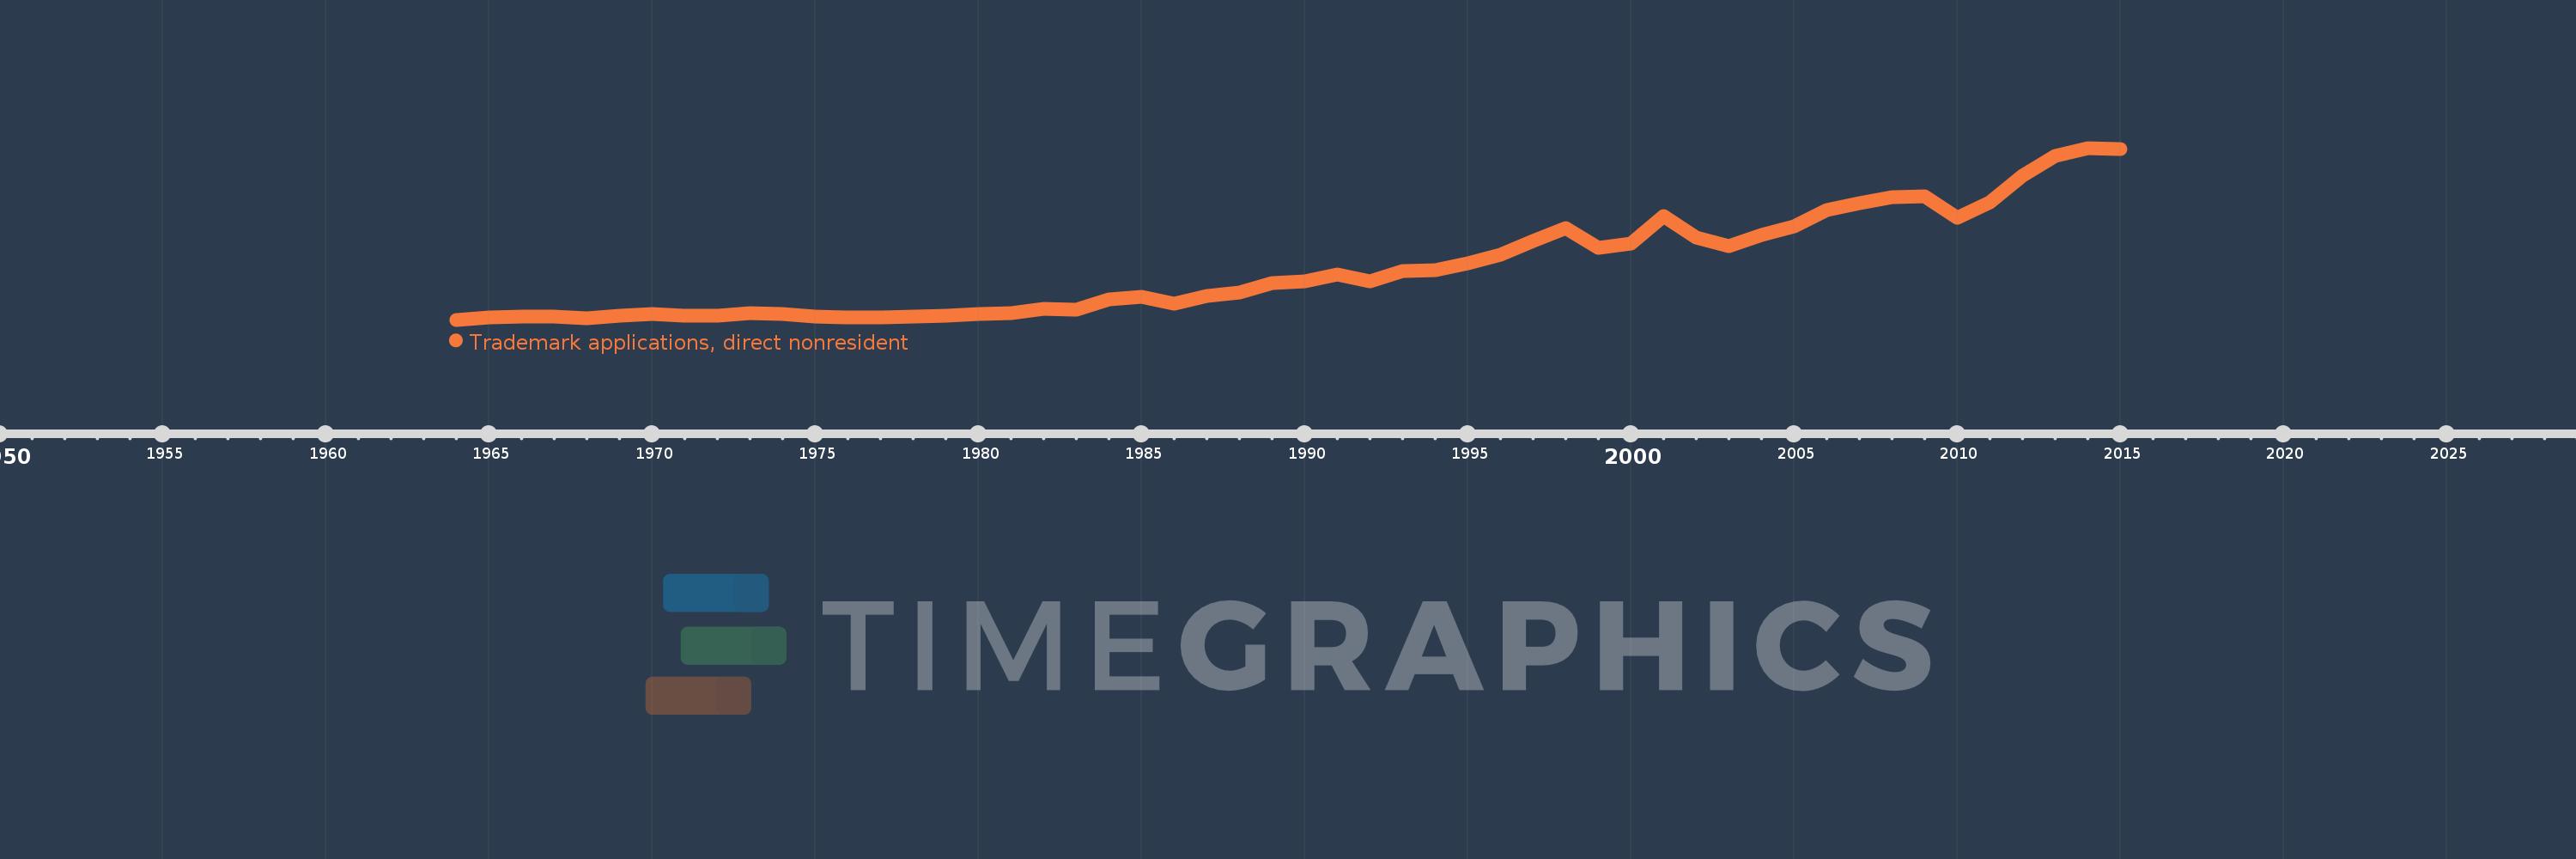
Trademark applications, direct nonresident
2015,2014,2013,2012,2011,2010,2009,2008,2007,2006,2005,2004,2003,2002,2001,2000,1999,1998,1997,1996,1995,1994,1993,1992,1991,1990,1989,1988,1987,1986,1985,1984,1983,1982,1981,1980,1979,1978,1977,1976,1975,1974,1973,1972,1971,1970,1969,1968,1967,1966,1965,1964
This statistics in other country:
AlbaniaAlgeriaAndorraAngolaAntigua and BarbudaArab WorldArgentinaArmeniaArubaAustraliaAustriaAzerbaijanBahamas, TheBahrainBangladeshBarbadosBelarusBelgiumBelizeBhutanBoliviaBosnia and HerzegovinaBotswanaBrazilBrunei DarussalamBulgariaBurundiCambodiaCanadaCaribbean small statesCentral Europe and the BalticsChileChinaColombiaCongo, Dem. Rep.Costa RicaCroatiaCubaCuracaoCyprusCzech RepublicDenmarkDjiboutiDominicaDominican RepublicEarly-demographic dividendEast Asia & PacificEast Asia & Pacific (excluding high income)East Asia & Pacific (IDA & IBRD countries)EcuadorEgypt, Arab Rep.El SalvadorEstoniaEthiopiaEuro areaEurope & Central AsiaEurope & Central Asia (excluding high income)Europe & Central Asia (IDA & IBRD countries)European UnionFijiFinlandFranceGambia, TheGeorgiaGermanyGhanaGreeceGrenadaGuatemalaGuyanaHaitiHigh incomeHondurasHong Kong SAR, ChinaHungaryIBRD onlyIcelandIDA & IBRD totalIDA blendIndiaIndonesiaIran, Islamic Rep.IraqIrelandIsraelItalyJamaicaJapanJordanKazakhstanKenyaKiribatiKorea, Dem. People’s Rep.Korea, Rep.KuwaitKyrgyz RepublicLao PDRLate-demographic dividendLatin America & Caribbean Latin America & Caribbean (excluding high income)Latin America & the Caribbean (IDA & IBRD countries)LatviaLebanonLesothoLiberiaLibyaLiechtensteinLithuaniaLow & middle incomeLower middle incomeLuxembourgMacao SAR, ChinaMacedonia, FYRMadagascarMalawiMalaysiaMaliMaltaMauritiusMexicoMiddle East & North AfricaMiddle East & North Africa (excluding high income)Middle East & North Africa (IDA & IBRD countries)Middle incomeMoldovaMonacoMongoliaMontenegroMoroccoMozambiqueMyanmarNamibiaNepalNetherlandsNew ZealandNicaraguaNigeriaNorth AmericaNorwayOECD membersOmanOther small statesPacific island small statesPakistanPanamaPapua New GuineaParaguayPeruPhilippinesPolandPortugalPost-demographic dividendQatarRomaniaRussian FederationRwandaSamoaSan MarinoSao Tome and PrincipeSaudi ArabiaSerbiaSeychellesSierra LeoneSingaporeSint Maarten (Dutch part)Slovak RepublicSloveniaSmall statesSolomon IslandsSomaliaSouth AfricaSouth AsiaSouth Asia (IDA & IBRD)SpainSri LankaSt. LuciaSt. Vincent and the GrenadinesSudanSurinameSwazilandSwedenSwitzerlandSyrian Arab RepublicTajikistanTanzaniaThailandTongaTrinidad and TobagoTunisiaTurkeyTurkmenistanTuvaluUgandaUkraineUnited Arab EmiratesUnited KingdomUnited StatesUpper middle incomeUruguayUzbekistanVenezuela, RBVietnamWorldYemen, Rep.ZambiaZimbabwe Timeline:
This timeline shows a graph from 1964 to 2015 of Thailand. No data until 1963. Number of actual observations by date: 52.
Source name:
World Development Indicators
Source organization:
World Intellectual Property Organization (WIPO), WIPO Patent Report: Statistics on Worldwide Patent Activity. The International Bureau of WIPO assumes no responsibility with respect to the transformation of these data.
Categories, topics:
Science & Technology
Last updated:
apr 23, 2017
Indicators value changes by year
Maximum:
18.216K
jan 1, 2014
At the date of observation
Value
Absolute change
Change from previous value
jan 1, 1964
1.38K
+1.38K
0.0%
jan 1, 1965
1.576K
+196.0
14.2%
jan 1, 1966
1.67K
+94.0
5.96%
jan 1, 1967
1.703K
+33.0
1.98%
jan 1, 1968
1.551K
-152.0
-8.93%
jan 1, 1969
1.783K
+232.0
14.96%
jan 1, 1970
1.967K
+184.0
10.32%
jan 1, 1971
1.779K
-188.0
-9.56%
jan 1, 1972
1.775K
-4.0
-0.22%
jan 1, 1973
2.002K
+227.0
12.79%
jan 1, 1974
1.919K
-83.0
-4.15%
jan 1, 1975
1.663K
-256.0
-13.34%
jan 1, 1976
1.633K
-30.0
-1.8%
jan 1, 1977
1.592K
-41.0
-2.51%
jan 1, 1978
1.727K
+135.0
8.48%
jan 1, 1979
1.781K
+54.0
3.13%
jan 1, 1980
1.925K
+144.0
8.09%
jan 1, 1981
2.049K
+124.0
6.44%
jan 1, 1982
2.467K
+418.0
20.4%
jan 1, 1983
2.402K
-65.0
-2.63%
jan 1, 1984
3.387K
+985.0
41.01%
jan 1, 1985
3.667K
+280.0
8.27%
jan 1, 1986
2.968K
-699.0
-19.06%
jan 1, 1987
3.724K
+756.0
25.47%
jan 1, 1988
4.053K
+329.0
8.83%
jan 1, 1989
4.962K
+909.0
22.43%
jan 1, 1990
5.148K
+186.0
3.75%
jan 1, 1991
5.839K
+691.0
13.42%
jan 1, 1992
5.148K
-691.0
-11.83%
jan 1, 1993
6.166K
+1.018K
19.77%
jan 1, 1994
6.273K
+107.0
1.74%
jan 1, 1995
6.907K
+634.0
10.11%
jan 1, 1996
7.748K
+841.0
12.18%
jan 1, 1997
9.064K
+1.316K
16.99%
jan 1, 1998
10.383K
+1.319K
14.55%
jan 1, 1999
8.385K
-1.998K
-19.24%
jan 1, 2000
8.838K
+453.0
5.4%
jan 1, 2001
11.56K
+2.722K
30.8%
jan 1, 2002
9.407K
-2.153K
-18.62%
jan 1, 2003
8.591K
-816.0
-8.67%
jan 1, 2004
9.714K
+1.123K
13.07%
jan 1, 2005
10.554K
+840.0
8.65%
jan 1, 2006
12.148K
+1.594K
15.1%
jan 1, 2007
12.776K
+628.0
5.17%
jan 1, 2008
13.415K
+639.0
5.0%
jan 1, 2009
13.472K
+57.0
0.42%
jan 1, 2010
11.353K
-2.119K
-15.73%
jan 1, 2011
12.875K
+1.522K
13.41%
jan 1, 2012
15.493K
+2.618K
20.33%
jan 1, 2013
17.455K
+1.962K
12.66%
jan 1, 2014
18.216K
+761.0
4.36%
jan 1, 2015
18.144K
-72.0
-0.4%
Ranking of countries by current statistics by years


Comments: