29
/
en
AIzaSyAYiBZKx7MnpbEhh9jyipgxe19OcubqV5w
April 1, 2024
141223
Ghana
GHA
true
2
1
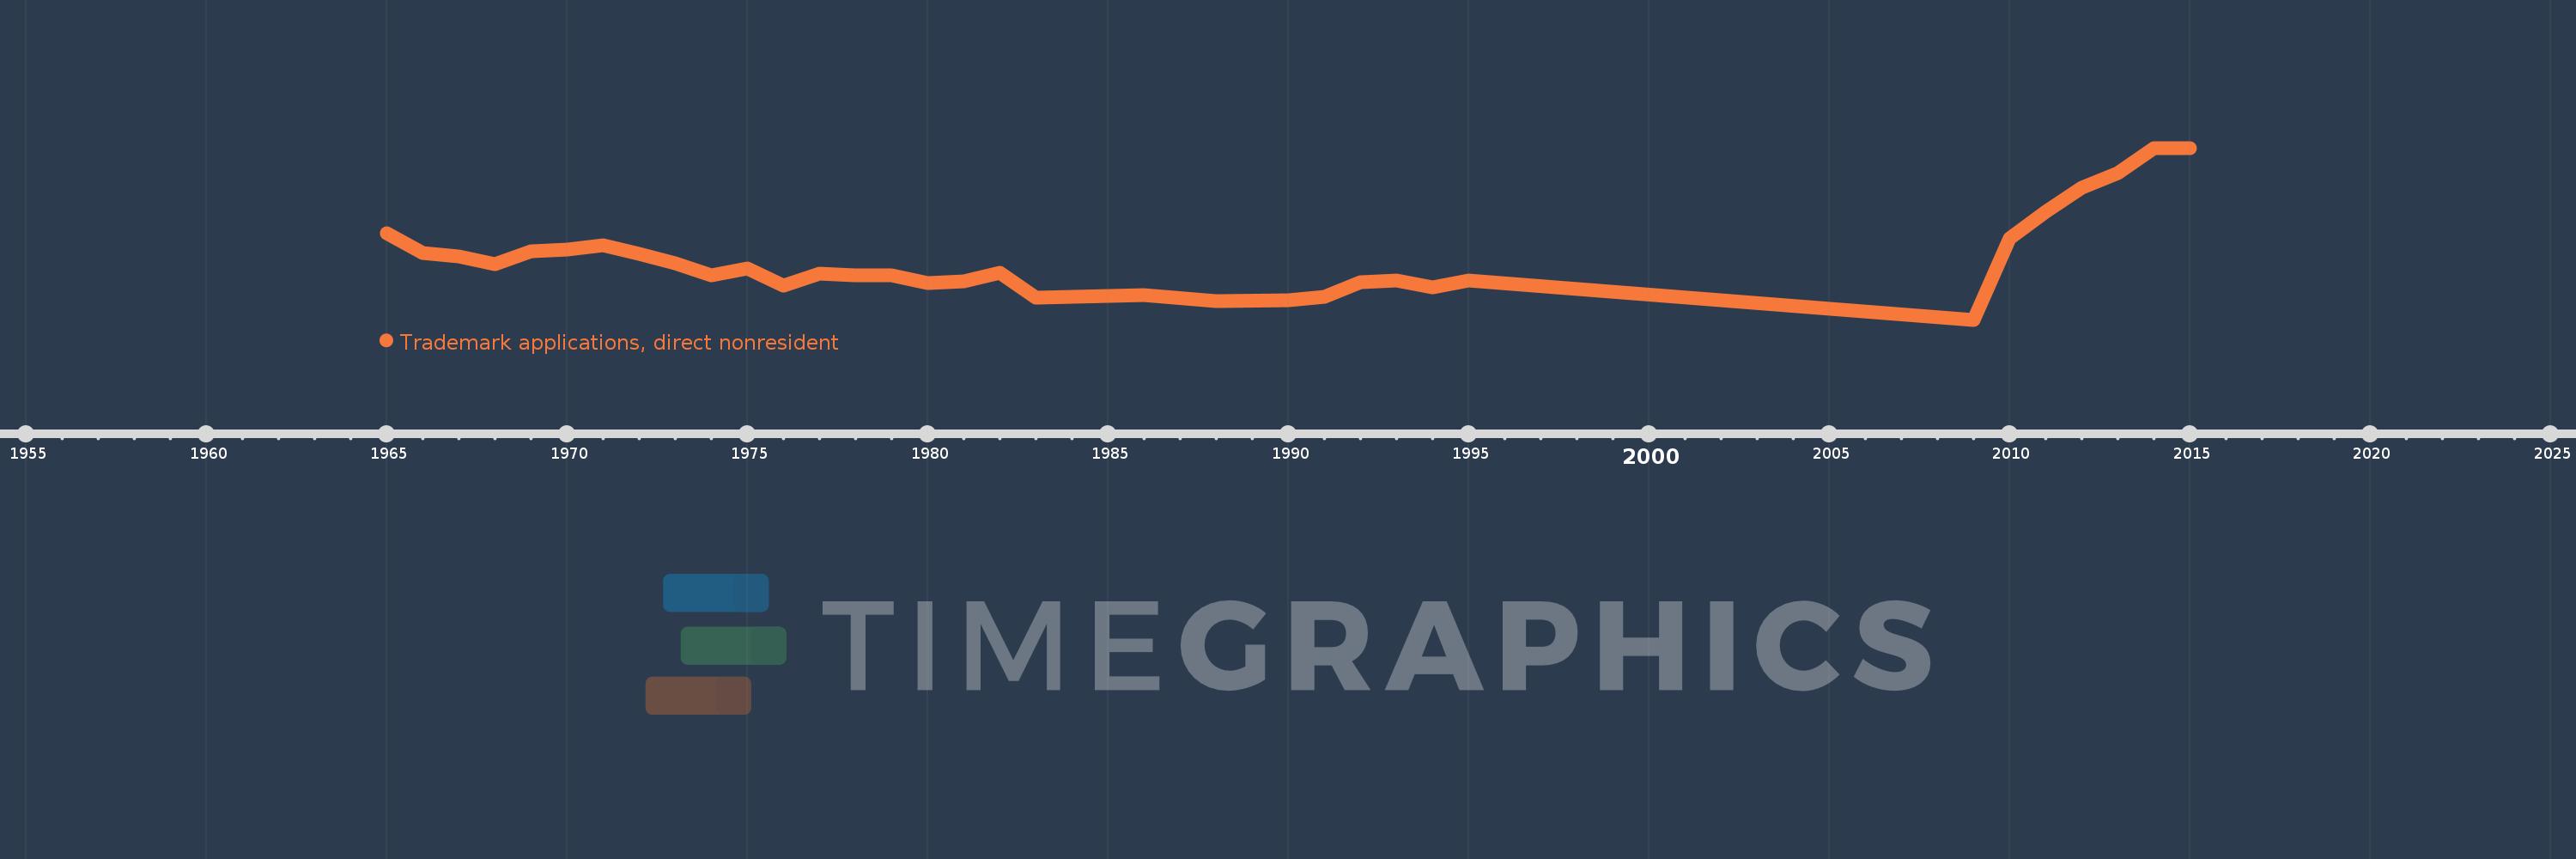
Trademark applications, direct nonresident
2015,2014,2013,2012,2011,2010,2009,1995,1994,1993,1992,1991,1990,1988,1986,1983,1982,1981,1980,1979,1978,1977,1976,1975,1974,1973,1972,1971,1970,1969,1968,1967,1966,1965
This statistics in other country:
AlbaniaAlgeriaAndorraAngolaAntigua and BarbudaArab WorldArgentinaArmeniaArubaAustraliaAustriaAzerbaijanBahamas, TheBahrainBangladeshBarbadosBelarusBelgiumBelizeBhutanBoliviaBosnia and HerzegovinaBotswanaBrazilBrunei DarussalamBulgariaBurundiCambodiaCanadaCaribbean small statesCentral Europe and the BalticsChileChinaColombiaCongo, Dem. Rep.Costa RicaCroatiaCubaCuracaoCyprusCzech RepublicDenmarkDjiboutiDominicaDominican RepublicEarly-demographic dividendEast Asia & PacificEast Asia & Pacific (excluding high income)East Asia & Pacific (IDA & IBRD countries)EcuadorEgypt, Arab Rep.El SalvadorEstoniaEthiopiaEuro areaEurope & Central AsiaEurope & Central Asia (excluding high income)Europe & Central Asia (IDA & IBRD countries)European UnionFijiFinlandFranceGambia, TheGeorgiaGermanyGhanaGreeceGrenadaGuatemalaGuyanaHaitiHigh incomeHondurasHong Kong SAR, ChinaHungaryIBRD onlyIcelandIDA & IBRD totalIDA blendIndiaIndonesiaIran, Islamic Rep.IraqIrelandIsraelItalyJamaicaJapanJordanKazakhstanKenyaKiribatiKorea, Dem. People’s Rep.Korea, Rep.KuwaitKyrgyz RepublicLao PDRLate-demographic dividendLatin America & Caribbean Latin America & Caribbean (excluding high income)Latin America & the Caribbean (IDA & IBRD countries)LatviaLebanonLesothoLiberiaLibyaLiechtensteinLithuaniaLow & middle incomeLower middle incomeLuxembourgMacao SAR, ChinaMacedonia, FYRMadagascarMalawiMalaysiaMaliMaltaMauritiusMexicoMiddle East & North AfricaMiddle East & North Africa (excluding high income)Middle East & North Africa (IDA & IBRD countries)Middle incomeMoldovaMonacoMongoliaMontenegroMoroccoMozambiqueMyanmarNamibiaNepalNetherlandsNew ZealandNicaraguaNigeriaNorth AmericaNorwayOECD membersOmanOther small statesPacific island small statesPakistanPanamaPapua New GuineaParaguayPeruPhilippinesPolandPortugalPost-demographic dividendQatarRomaniaRussian FederationRwandaSamoaSan MarinoSao Tome and PrincipeSaudi ArabiaSerbiaSeychellesSierra LeoneSingaporeSint Maarten (Dutch part)Slovak RepublicSloveniaSmall statesSolomon IslandsSomaliaSouth AfricaSouth AsiaSouth Asia (IDA & IBRD)SpainSri LankaSt. LuciaSt. Vincent and the GrenadinesSudanSurinameSwazilandSwedenSwitzerlandSyrian Arab RepublicTajikistanTanzaniaThailandTongaTrinidad and TobagoTunisiaTurkeyTurkmenistanTuvaluUgandaUkraineUnited Arab EmiratesUnited KingdomUnited StatesUpper middle incomeUruguayUzbekistanVenezuela, RBVietnamWorldYemen, Rep.ZambiaZimbabwe Timeline:
This timeline shows a graph from 1965 to 2015 of Ghana. No data until 1964. Number of actual observations by date: 34.
Source name:
World Development Indicators
Source organization:
World Intellectual Property Organization (WIPO), WIPO Patent Report: Statistics on Worldwide Patent Activity. The International Bureau of WIPO assumes no responsibility with respect to the transformation of these data.
Categories, topics:
Science & Technology
Last updated:
apr 23, 2017
Indicators value changes by year
Maximum:
1.366K
jan 1, 2015
At the date of observation
Value
Absolute change
Change from previous value
jan 1, 1965
718.0
+718.0
0.0%
jan 1, 1966
567.0
-151.0
-21.03%
jan 1, 1967
539.0
-28.0
-4.94%
jan 1, 1968
480.0
-59.0
-10.95%
jan 1, 1969
584.0
+104.0
21.67%
jan 1, 1970
596.0
+12.0
2.05%
jan 1, 1971
625.0
+29.0
4.87%
jan 1, 1972
562.0
-63.0
-10.08%
jan 1, 1973
489.0
-73.0
-12.99%
jan 1, 1974
399.0
-90.0
-18.4%
jan 1, 1975
451.0
+52.0
13.03%
jan 1, 1976
319.0
-132.0
-29.27%
jan 1, 1977
412.0
+93.0
29.15%
jan 1, 1978
396.0
-16.0
-3.88%
jan 1, 1979
400.0
+4.0
1.01%
jan 1, 1980
341.0
-59.0
-14.75%
jan 1, 1981
353.0
+12.0
3.52%
jan 1, 1982
419.0
+66.0
18.7%
jan 1, 1983
230.0
-189.0
-45.11%
jan 1, 1986
250.0
+20.0
8.7%
jan 1, 1988
205.0
-45.0
-18.0%
jan 1, 1990
212.0
+7.0
3.41%
jan 1, 1991
232.0
+20.0
9.43%
jan 1, 1992
346.0
+114.0
49.14%
jan 1, 1993
356.0
+10.0
2.89%
jan 1, 1994
308.0
-48.0
-13.48%
jan 1, 1995
358.0
+50.0
16.23%
jan 1, 2009
61.0
-297.0
-82.96%
jan 1, 2010
677.0
+616.0
1.01K%
jan 1, 2011
882.0
+205.0
30.28%
jan 1, 2012
1.067K
+185.0
20.98%
jan 1, 2013
1.177K
+110.0
10.31%
jan 1, 2014
1.365K
+188.0
15.97%
jan 1, 2015
1.366K
+1.0
0.07%
Ranking of countries by current statistics by years


Comments: