29
/
en
AIzaSyAYiBZKx7MnpbEhh9jyipgxe19OcubqV5w
April 1, 2024
202400
Morocco
MAR
true
2
1
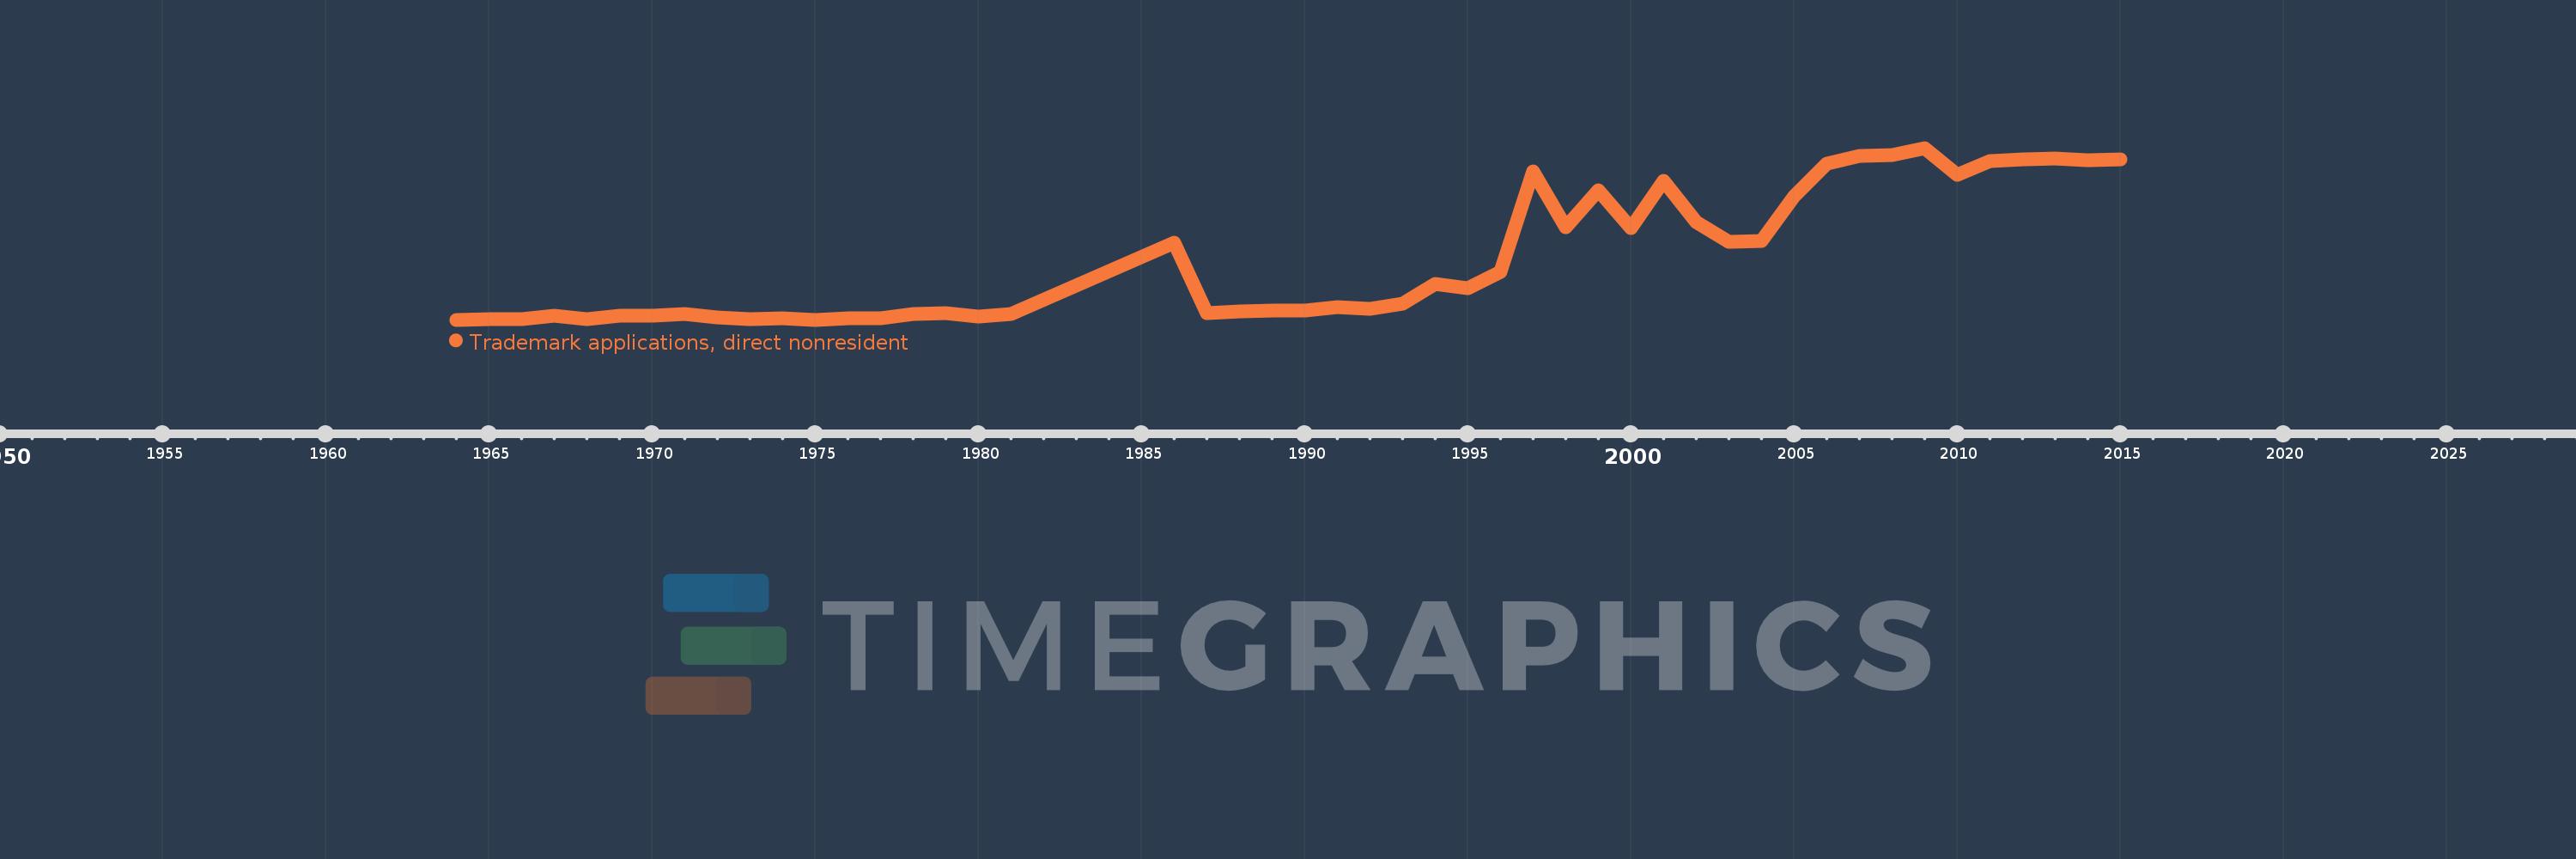
Trademark applications, direct nonresident
2015,2014,2013,2012,2011,2010,2009,2008,2007,2006,2005,2004,2003,2002,2001,2000,1999,1998,1997,1996,1995,1994,1993,1992,1991,1990,1989,1988,1987,1986,1981,1980,1979,1978,1977,1976,1975,1974,1973,1972,1971,1970,1969,1968,1967,1966,1965,1964
This statistics in other country:
AlbaniaAlgeriaAndorraAngolaAntigua and BarbudaArab WorldArgentinaArmeniaArubaAustraliaAustriaAzerbaijanBahamas, TheBahrainBangladeshBarbadosBelarusBelgiumBelizeBhutanBoliviaBosnia and HerzegovinaBotswanaBrazilBrunei DarussalamBulgariaBurundiCambodiaCanadaCaribbean small statesCentral Europe and the BalticsChileChinaColombiaCongo, Dem. Rep.Costa RicaCroatiaCubaCuracaoCyprusCzech RepublicDenmarkDjiboutiDominicaDominican RepublicEarly-demographic dividendEast Asia & PacificEast Asia & Pacific (excluding high income)East Asia & Pacific (IDA & IBRD countries)EcuadorEgypt, Arab Rep.El SalvadorEstoniaEthiopiaEuro areaEurope & Central AsiaEurope & Central Asia (excluding high income)Europe & Central Asia (IDA & IBRD countries)European UnionFijiFinlandFranceGambia, TheGeorgiaGermanyGhanaGreeceGrenadaGuatemalaGuyanaHaitiHigh incomeHondurasHong Kong SAR, ChinaHungaryIBRD onlyIcelandIDA & IBRD totalIDA blendIndiaIndonesiaIran, Islamic Rep.IraqIrelandIsraelItalyJamaicaJapanJordanKazakhstanKenyaKiribatiKorea, Dem. People’s Rep.Korea, Rep.KuwaitKyrgyz RepublicLao PDRLate-demographic dividendLatin America & Caribbean Latin America & Caribbean (excluding high income)Latin America & the Caribbean (IDA & IBRD countries)LatviaLebanonLesothoLiberiaLibyaLiechtensteinLithuaniaLow & middle incomeLower middle incomeLuxembourgMacao SAR, ChinaMacedonia, FYRMadagascarMalawiMalaysiaMaliMaltaMauritiusMexicoMiddle East & North AfricaMiddle East & North Africa (excluding high income)Middle East & North Africa (IDA & IBRD countries)Middle incomeMoldovaMonacoMongoliaMontenegroMoroccoMozambiqueMyanmarNamibiaNepalNetherlandsNew ZealandNicaraguaNigeriaNorth AmericaNorwayOECD membersOmanOther small statesPacific island small statesPakistanPanamaPapua New GuineaParaguayPeruPhilippinesPolandPortugalPost-demographic dividendQatarRomaniaRussian FederationRwandaSamoaSan MarinoSao Tome and PrincipeSaudi ArabiaSerbiaSeychellesSierra LeoneSingaporeSint Maarten (Dutch part)Slovak RepublicSloveniaSmall statesSolomon IslandsSomaliaSouth AfricaSouth AsiaSouth Asia (IDA & IBRD)SpainSri LankaSt. LuciaSt. Vincent and the GrenadinesSudanSurinameSwazilandSwedenSwitzerlandSyrian Arab RepublicTajikistanTanzaniaThailandTongaTrinidad and TobagoTunisiaTurkeyTurkmenistanTuvaluUgandaUkraineUnited Arab EmiratesUnited KingdomUnited StatesUpper middle incomeUruguayUzbekistanVenezuela, RBVietnamWorldYemen, Rep.ZambiaZimbabwe Timeline:
This timeline shows a graph from 1964 to 2015 of Morocco. No data until 1963. Number of actual observations by date: 48.
Source name:
World Development Indicators
Source organization:
World Intellectual Property Organization (WIPO), WIPO Patent Report: Statistics on Worldwide Patent Activity. The International Bureau of WIPO assumes no responsibility with respect to the transformation of these data.
Categories, topics:
Science & Technology
Last updated:
apr 23, 2017
Indicators value changes by year
Maximum:
5.925K
jan 1, 2009
At the date of observation
Value
Absolute change
Change from previous value
jan 1, 1964
276.0
+276.0
0.0%
jan 1, 1965
286.0
+10.0
3.62%
jan 1, 1966
295.0
+9.0
3.15%
jan 1, 1967
418.0
+123.0
41.69%
jan 1, 1968
309.0
-109.0
-26.08%
jan 1, 1969
395.0
+86.0
27.83%
jan 1, 1970
397.0
+2.0
0.51%
jan 1, 1971
463.0
+66.0
16.62%
jan 1, 1972
359.0
-104.0
-22.46%
jan 1, 1973
298.0
-61.0
-16.99%
jan 1, 1974
310.0
+12.0
4.03%
jan 1, 1975
278.0
-32.0
-10.32%
jan 1, 1976
315.0
+37.0
13.31%
jan 1, 1977
321.0
+6.0
1.9%
jan 1, 1978
470.0
+149.0
46.42%
jan 1, 1979
492.0
+22.0
4.68%
jan 1, 1980
373.0
-119.0
-24.19%
jan 1, 1981
456.0
+83.0
22.25%
jan 1, 1986
2.82K
+2.364K
518.42%
jan 1, 1987
483.0
-2.337K
-82.87%
jan 1, 1988
554.0
+71.0
14.7%
jan 1, 1989
583.0
+29.0
5.23%
jan 1, 1990
569.0
-14.0
-2.4%
jan 1, 1991
681.0
+112.0
19.68%
jan 1, 1992
621.0
-60.0
-8.81%
jan 1, 1993
799.0
+178.0
28.66%
jan 1, 1994
1.444K
+645.0
80.73%
jan 1, 1995
1.299K
-145.0
-10.04%
jan 1, 1996
1.853K
+554.0
42.65%
jan 1, 1997
5.154K
+3.301K
178.14%
jan 1, 1998
3.312K
-1.842K
-35.74%
jan 1, 1999
4.54K
+1.228K
37.08%
jan 1, 2000
3.283K
-1.257K
-27.69%
jan 1, 2001
4.839K
+1.556K
47.4%
jan 1, 2002
3.499K
-1.34K
-27.69%
jan 1, 2003
2.849K
-650.0
-18.58%
jan 1, 2004
2.875K
+26.0
0.91%
jan 1, 2005
4.335K
+1.46K
50.78%
jan 1, 2006
5.401K
+1.066K
24.59%
jan 1, 2007
5.661K
+260.0
4.81%
jan 1, 2008
5.702K
+41.0
0.72%
jan 1, 2009
5.925K
+223.0
3.91%
jan 1, 2010
5.043K
-882.0
-14.89%
jan 1, 2011
5.502K
+459.0
9.1%
jan 1, 2012
5.562K
+60.0
1.09%
jan 1, 2013
5.575K
+13.0
0.23%
jan 1, 2014
5.518K
-57.0
-1.02%
jan 1, 2015
5.543K
+25.0
0.45%
Ranking of countries by current statistics by years


Comments: