29
/
en
AIzaSyAYiBZKx7MnpbEhh9jyipgxe19OcubqV5w
April 1, 2024
94360
Bulgaria
BGR
true
2
1
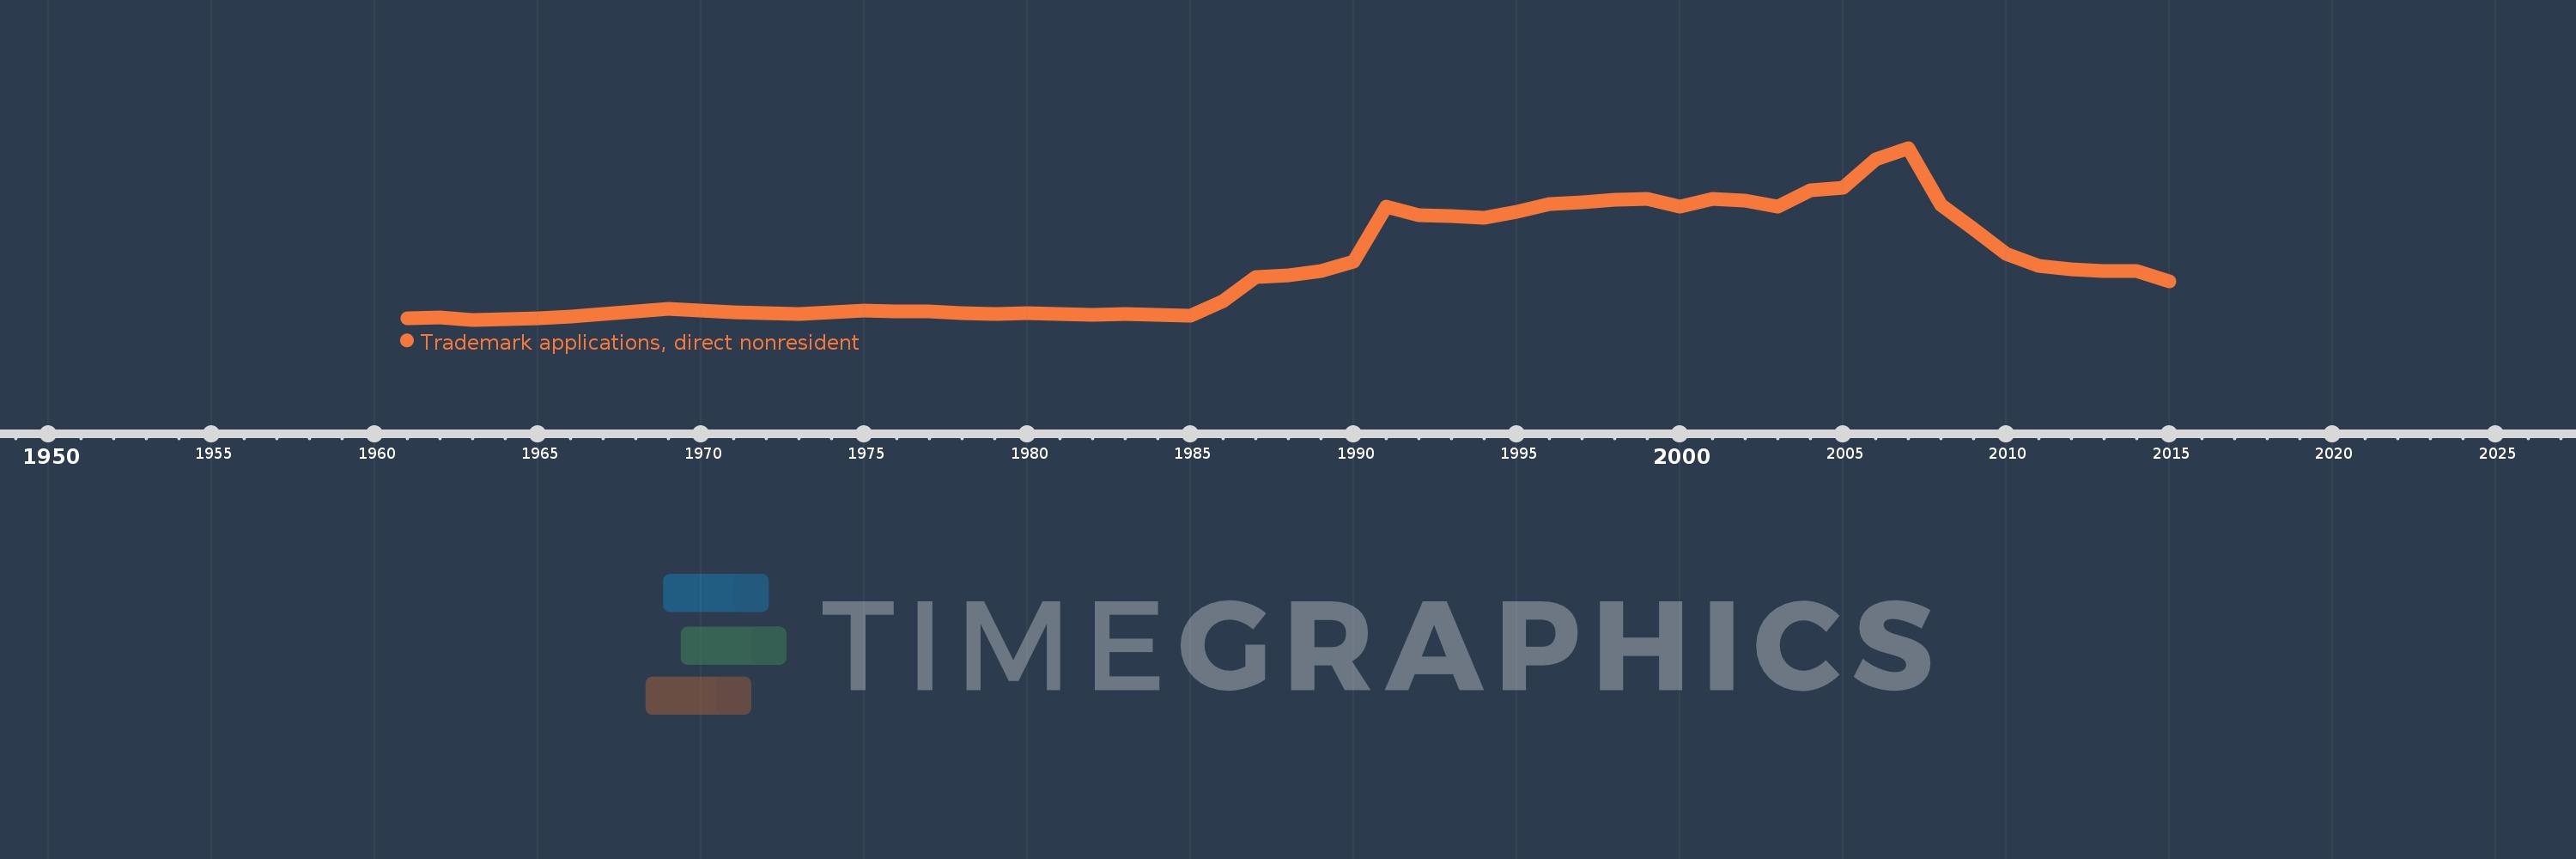
Trademark applications, direct nonresident
2015,2014,2013,2012,2011,2010,2009,2008,2007,2006,2005,2004,2003,2002,2001,2000,1999,1998,1997,1996,1995,1994,1993,1992,1991,1990,1989,1988,1987,1986,1985,1984,1983,1982,1981,1980,1979,1978,1977,1976,1975,1974,1973,1972,1971,1970,1969,1968,1967,1966,1965,1964,1963,1962,1961
This statistics in other country:
AlbaniaAlgeriaAndorraAngolaAntigua and BarbudaArab WorldArgentinaArmeniaArubaAustraliaAustriaAzerbaijanBahamas, TheBahrainBangladeshBarbadosBelarusBelgiumBelizeBhutanBoliviaBosnia and HerzegovinaBotswanaBrazilBrunei DarussalamBulgariaBurundiCambodiaCanadaCaribbean small statesCentral Europe and the BalticsChileChinaColombiaCongo, Dem. Rep.Costa RicaCroatiaCubaCuracaoCyprusCzech RepublicDenmarkDjiboutiDominicaDominican RepublicEarly-demographic dividendEast Asia & PacificEast Asia & Pacific (excluding high income)East Asia & Pacific (IDA & IBRD countries)EcuadorEgypt, Arab Rep.El SalvadorEstoniaEthiopiaEuro areaEurope & Central AsiaEurope & Central Asia (excluding high income)Europe & Central Asia (IDA & IBRD countries)European UnionFijiFinlandFranceGambia, TheGeorgiaGermanyGhanaGreeceGrenadaGuatemalaGuyanaHaitiHigh incomeHondurasHong Kong SAR, ChinaHungaryIBRD onlyIcelandIDA & IBRD totalIDA blendIndiaIndonesiaIran, Islamic Rep.IraqIrelandIsraelItalyJamaicaJapanJordanKazakhstanKenyaKiribatiKorea, Dem. People’s Rep.Korea, Rep.KuwaitKyrgyz RepublicLao PDRLate-demographic dividendLatin America & Caribbean Latin America & Caribbean (excluding high income)Latin America & the Caribbean (IDA & IBRD countries)LatviaLebanonLesothoLiberiaLibyaLiechtensteinLithuaniaLow & middle incomeLower middle incomeLuxembourgMacao SAR, ChinaMacedonia, FYRMadagascarMalawiMalaysiaMaliMaltaMauritiusMexicoMiddle East & North AfricaMiddle East & North Africa (excluding high income)Middle East & North Africa (IDA & IBRD countries)Middle incomeMoldovaMonacoMongoliaMontenegroMoroccoMozambiqueMyanmarNamibiaNepalNetherlandsNew ZealandNicaraguaNigeriaNorth AmericaNorwayOECD membersOmanOther small statesPacific island small statesPakistanPanamaPapua New GuineaParaguayPeruPhilippinesPolandPortugalPost-demographic dividendQatarRomaniaRussian FederationRwandaSamoaSan MarinoSao Tome and PrincipeSaudi ArabiaSerbiaSeychellesSierra LeoneSingaporeSint Maarten (Dutch part)Slovak RepublicSloveniaSmall statesSolomon IslandsSomaliaSouth AfricaSouth AsiaSouth Asia (IDA & IBRD)SpainSri LankaSt. LuciaSt. Vincent and the GrenadinesSudanSurinameSwazilandSwedenSwitzerlandSyrian Arab RepublicTajikistanTanzaniaThailandTongaTrinidad and TobagoTunisiaTurkeyTurkmenistanTuvaluUgandaUkraineUnited Arab EmiratesUnited KingdomUnited StatesUpper middle incomeUruguayUzbekistanVenezuela, RBVietnamWorldYemen, Rep.ZambiaZimbabwe Timeline:
This timeline shows a graph from 1961 to 2015 of Bulgaria. No data until 1960. Number of actual observations by date: 55.
Source name:
World Development Indicators
Source organization:
World Intellectual Property Organization (WIPO), WIPO Patent Report: Statistics on Worldwide Patent Activity. The International Bureau of WIPO assumes no responsibility with respect to the transformation of these data.
Categories, topics:
Science & Technology
Last updated:
apr 23, 2017
Indicators value changes by year
At the date of observation
Value
Absolute change
Change from previous value
jan 1, 1961
211.0
+211.0
0.0%
jan 1, 1962
267.0
+56.0
26.54%
jan 1, 1963
157.0
-110.0
-41.2%
jan 1, 1964
182.0
+25.0
15.92%
jan 1, 1965
226.0
+44.0
24.18%
jan 1, 1966
314.0
+88.0
38.94%
jan 1, 1967
446.0
+132.0
42.04%
jan 1, 1968
562.0
+116.0
26.01%
jan 1, 1969
701.0
+139.0
24.73%
jan 1, 1970
586.0
-115.0
-16.41%
jan 1, 1971
506.0
-80.0
-13.65%
jan 1, 1972
473.0
-33.0
-6.52%
jan 1, 1973
443.0
-30.0
-6.34%
jan 1, 1974
533.0
+90.0
20.32%
jan 1, 1975
598.0
+65.0
12.2%
jan 1, 1976
574.0
-24.0
-4.01%
jan 1, 1977
550.0
-24.0
-4.18%
jan 1, 1978
482.0
-68.0
-12.36%
jan 1, 1979
453.0
-29.0
-6.02%
jan 1, 1980
464.0
+11.0
2.43%
jan 1, 1981
453.0
-11.0
-2.37%
jan 1, 1982
399.0
-54.0
-11.92%
jan 1, 1983
414.0
+15.0
3.76%
jan 1, 1984
381.0
-33.0
-7.97%
jan 1, 1985
337.0
-44.0
-11.55%
jan 1, 1986
1.035K
+698.0
207.12%
jan 1, 1987
2.21K
+1.175K
113.53%
jan 1, 1988
2.295K
+85.0
3.85%
jan 1, 1989
2.483K
+188.0
8.19%
jan 1, 1990
2.948K
+465.0
18.73%
jan 1, 1991
5.597K
+2.649K
89.86%
jan 1, 1992
5.177K
-420.0
-7.5%
jan 1, 1993
5.154K
-23.0
-0.44%
jan 1, 1994
5.045K
-109.0
-2.11%
jan 1, 1995
5.335K
+290.0
5.75%
jan 1, 1996
5.714K
+379.0
7.1%
jan 1, 1997
5.8K
+86.0
1.51%
jan 1, 1998
5.909K
+109.0
1.88%
jan 1, 1999
5.945K
+36.0
0.61%
jan 1, 2000
5.572K
-373.0
-6.27%
jan 1, 2001
5.962K
+390.0
7.0%
jan 1, 2002
5.894K
-68.0
-1.14%
jan 1, 2003
5.576K
-318.0
-5.4%
jan 1, 2004
6.385K
+809.0
14.51%
jan 1, 2005
6.499K
+114.0
1.79%
jan 1, 2006
7.861K
+1.362K
20.96%
jan 1, 2007
8.41K
+549.0
6.98%
jan 1, 2008
5.671K
-2.739K
-32.57%
jan 1, 2009
4.538K
-1.133K
-19.98%
jan 1, 2010
3.326K
-1.212K
-26.71%
jan 1, 2011
2.738K
-588.0
-17.68%
jan 1, 2012
2.568K
-170.0
-6.21%
jan 1, 2013
2.489K
-79.0
-3.08%
jan 1, 2014
2.497K
+8.0
0.32%
jan 1, 2015
1.99K
-507.0
-20.3%
Ranking of countries by current statistics by years


Comments: