29
/
en
AIzaSyAYiBZKx7MnpbEhh9jyipgxe19OcubqV5w
April 1, 2024
209866
New Zealand
NZL
true
2
1
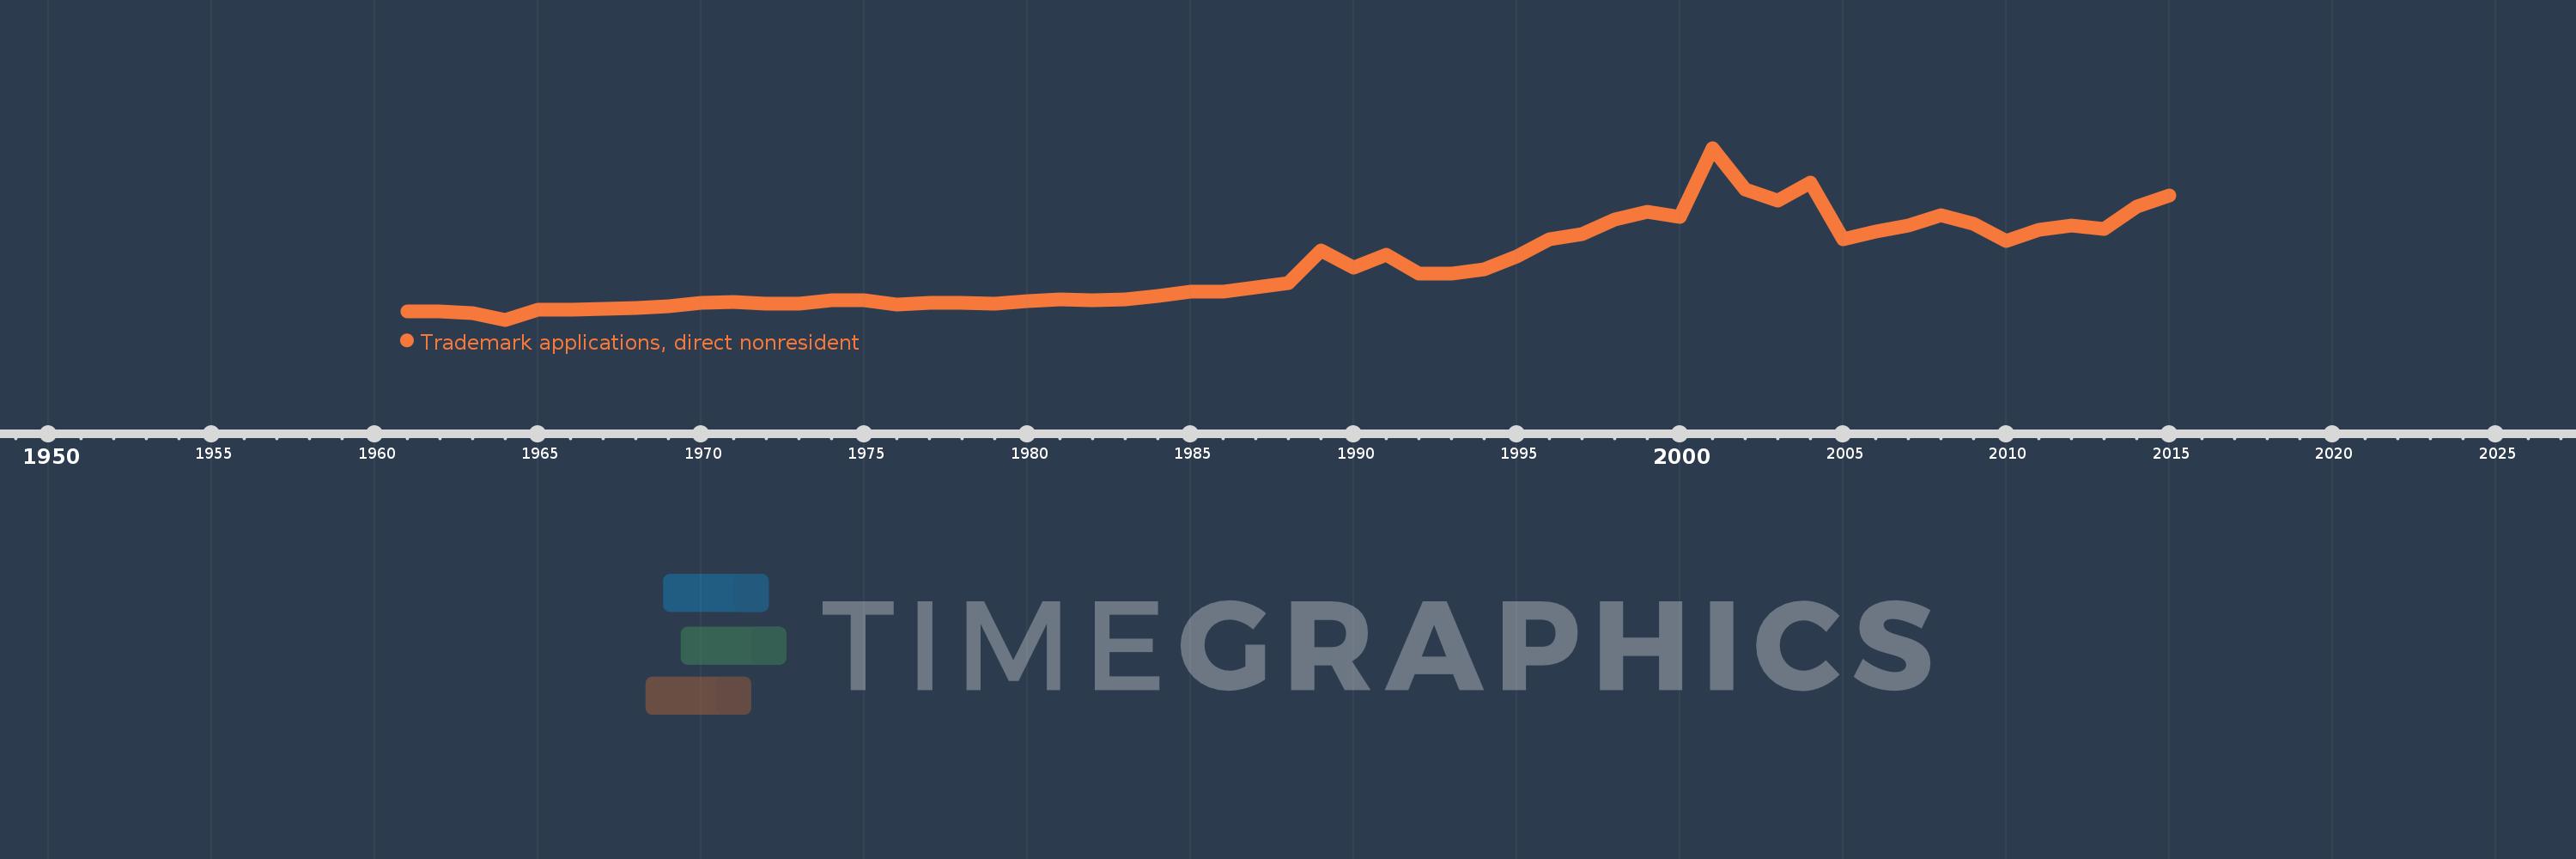
Trademark applications, direct nonresident
2015,2014,2013,2012,2011,2010,2009,2008,2007,2006,2005,2004,2003,2002,2001,2000,1999,1998,1997,1996,1995,1994,1993,1992,1991,1990,1989,1988,1986,1985,1984,1983,1982,1981,1980,1979,1978,1977,1976,1975,1974,1973,1972,1971,1970,1969,1968,1967,1966,1965,1964,1963,1962,1961
This statistics in other country:
AlbaniaAlgeriaAndorraAngolaAntigua and BarbudaArab WorldArgentinaArmeniaArubaAustraliaAustriaAzerbaijanBahamas, TheBahrainBangladeshBarbadosBelarusBelgiumBelizeBhutanBoliviaBosnia and HerzegovinaBotswanaBrazilBrunei DarussalamBulgariaBurundiCambodiaCanadaCaribbean small statesCentral Europe and the BalticsChileChinaColombiaCongo, Dem. Rep.Costa RicaCroatiaCubaCuracaoCyprusCzech RepublicDenmarkDjiboutiDominicaDominican RepublicEarly-demographic dividendEast Asia & PacificEast Asia & Pacific (excluding high income)East Asia & Pacific (IDA & IBRD countries)EcuadorEgypt, Arab Rep.El SalvadorEstoniaEthiopiaEuro areaEurope & Central AsiaEurope & Central Asia (excluding high income)Europe & Central Asia (IDA & IBRD countries)European UnionFijiFinlandFranceGambia, TheGeorgiaGermanyGhanaGreeceGrenadaGuatemalaGuyanaHaitiHigh incomeHondurasHong Kong SAR, ChinaHungaryIBRD onlyIcelandIDA & IBRD totalIDA blendIndiaIndonesiaIran, Islamic Rep.IraqIrelandIsraelItalyJamaicaJapanJordanKazakhstanKenyaKiribatiKorea, Dem. People’s Rep.Korea, Rep.KuwaitKyrgyz RepublicLao PDRLate-demographic dividendLatin America & Caribbean Latin America & Caribbean (excluding high income)Latin America & the Caribbean (IDA & IBRD countries)LatviaLebanonLesothoLiberiaLibyaLiechtensteinLithuaniaLow & middle incomeLower middle incomeLuxembourgMacao SAR, ChinaMacedonia, FYRMadagascarMalawiMalaysiaMaliMaltaMauritiusMexicoMiddle East & North AfricaMiddle East & North Africa (excluding high income)Middle East & North Africa (IDA & IBRD countries)Middle incomeMoldovaMonacoMongoliaMontenegroMoroccoMozambiqueMyanmarNamibiaNepalNetherlandsNew ZealandNicaraguaNigeriaNorth AmericaNorwayOECD membersOmanOther small statesPacific island small statesPakistanPanamaPapua New GuineaParaguayPeruPhilippinesPolandPortugalPost-demographic dividendQatarRomaniaRussian FederationRwandaSamoaSan MarinoSao Tome and PrincipeSaudi ArabiaSerbiaSeychellesSierra LeoneSingaporeSint Maarten (Dutch part)Slovak RepublicSloveniaSmall statesSolomon IslandsSomaliaSouth AfricaSouth AsiaSouth Asia (IDA & IBRD)SpainSri LankaSt. LuciaSt. Vincent and the GrenadinesSudanSurinameSwazilandSwedenSwitzerlandSyrian Arab RepublicTajikistanTanzaniaThailandTongaTrinidad and TobagoTunisiaTurkeyTurkmenistanTuvaluUgandaUkraineUnited Arab EmiratesUnited KingdomUnited StatesUpper middle incomeUruguayUzbekistanVenezuela, RBVietnamWorldYemen, Rep.ZambiaZimbabwe Timeline:
This timeline shows a graph from 1961 to 2015 of New Zealand. No data until 1960. Number of actual observations by date: 54.
Source name:
World Development Indicators
Source organization:
World Intellectual Property Organization (WIPO), WIPO Patent Report: Statistics on Worldwide Patent Activity. The International Bureau of WIPO assumes no responsibility with respect to the transformation of these data.
Categories, topics:
Science & Technology
Last updated:
apr 23, 2017
Indicators value changes by year
Maximum:
15.822K
jan 1, 2001
At the date of observation
Value
Absolute change
Change from previous value
jan 1, 1961
1.609K
+1.609K
0.0%
jan 1, 1962
1.611K
+2.0
0.12%
jan 1, 1963
1.479K
-132.0
-8.19%
jan 1, 1964
897.0
-582.0
-39.35%
jan 1, 1965
1.772K
+875.0
97.55%
jan 1, 1966
1.79K
+18.0
1.02%
jan 1, 1967
1.858K
+68.0
3.8%
jan 1, 1968
1.956K
+98.0
5.27%
jan 1, 1969
2.061K
+105.0
5.37%
jan 1, 1970
2.338K
+277.0
13.44%
jan 1, 1971
2.428K
+90.0
3.85%
jan 1, 1972
2.278K
-150.0
-6.18%
jan 1, 1973
2.264K
-14.0
-0.61%
jan 1, 1974
2.611K
+347.0
15.33%
jan 1, 1975
2.569K
-42.0
-1.61%
jan 1, 1976
2.186K
-383.0
-14.91%
jan 1, 1977
2.363K
+177.0
8.1%
jan 1, 1978
2.377K
+14.0
0.59%
jan 1, 1979
2.28K
-97.0
-4.08%
jan 1, 1980
2.529K
+249.0
10.92%
jan 1, 1981
2.702K
+173.0
6.84%
jan 1, 1982
2.616K
-86.0
-3.18%
jan 1, 1983
2.699K
+83.0
3.17%
jan 1, 1984
2.941K
+242.0
8.97%
jan 1, 1985
3.368K
+427.0
14.52%
jan 1, 1986
3.361K
-7.0
-0.21%
jan 1, 1988
4.05K
+689.0
20.5%
jan 1, 1989
6.928K
+2.878K
71.06%
jan 1, 1990
5.429K
-1.499K
-21.64%
jan 1, 1991
6.544K
+1.115K
20.54%
jan 1, 1992
4.902K
-1.642K
-25.09%
jan 1, 1993
4.904K
+2.0
0.04%
jan 1, 1994
5.29K
+386.0
7.87%
jan 1, 1995
6.393K
+1.103K
20.85%
jan 1, 1996
7.864K
+1.471K
23.01%
jan 1, 1997
8.329K
+465.0
5.91%
jan 1, 1998
9.632K
+1.303K
15.64%
jan 1, 1999
10.297K
+665.0
6.9%
jan 1, 2000
9.8K
-497.0
-4.83%
jan 1, 2001
15.822K
+6.022K
61.45%
jan 1, 2002
12.232K
-3.59K
-22.69%
jan 1, 2003
11.276K
-956.0
-7.82%
jan 1, 2004
12.784K
+1.508K
13.37%
jan 1, 2005
7.864K
-4.92K
-38.49%
jan 1, 2006
8.564K
+700.0
8.9%
jan 1, 2007
9.075K
+511.0
5.97%
jan 1, 2008
9.945K
+870.0
9.59%
jan 1, 2009
9.252K
-693.0
-6.97%
jan 1, 2010
7.752K
-1.5K
-16.21%
jan 1, 2011
8.695K
+943.0
12.16%
jan 1, 2012
9.116K
+421.0
4.84%
jan 1, 2013
8.786K
-330.0
-3.62%
jan 1, 2014
10.69K
+1.904K
21.67%
jan 1, 2015
11.67K
+980.0
9.17%
Ranking of countries by current statistics by years


Comments: