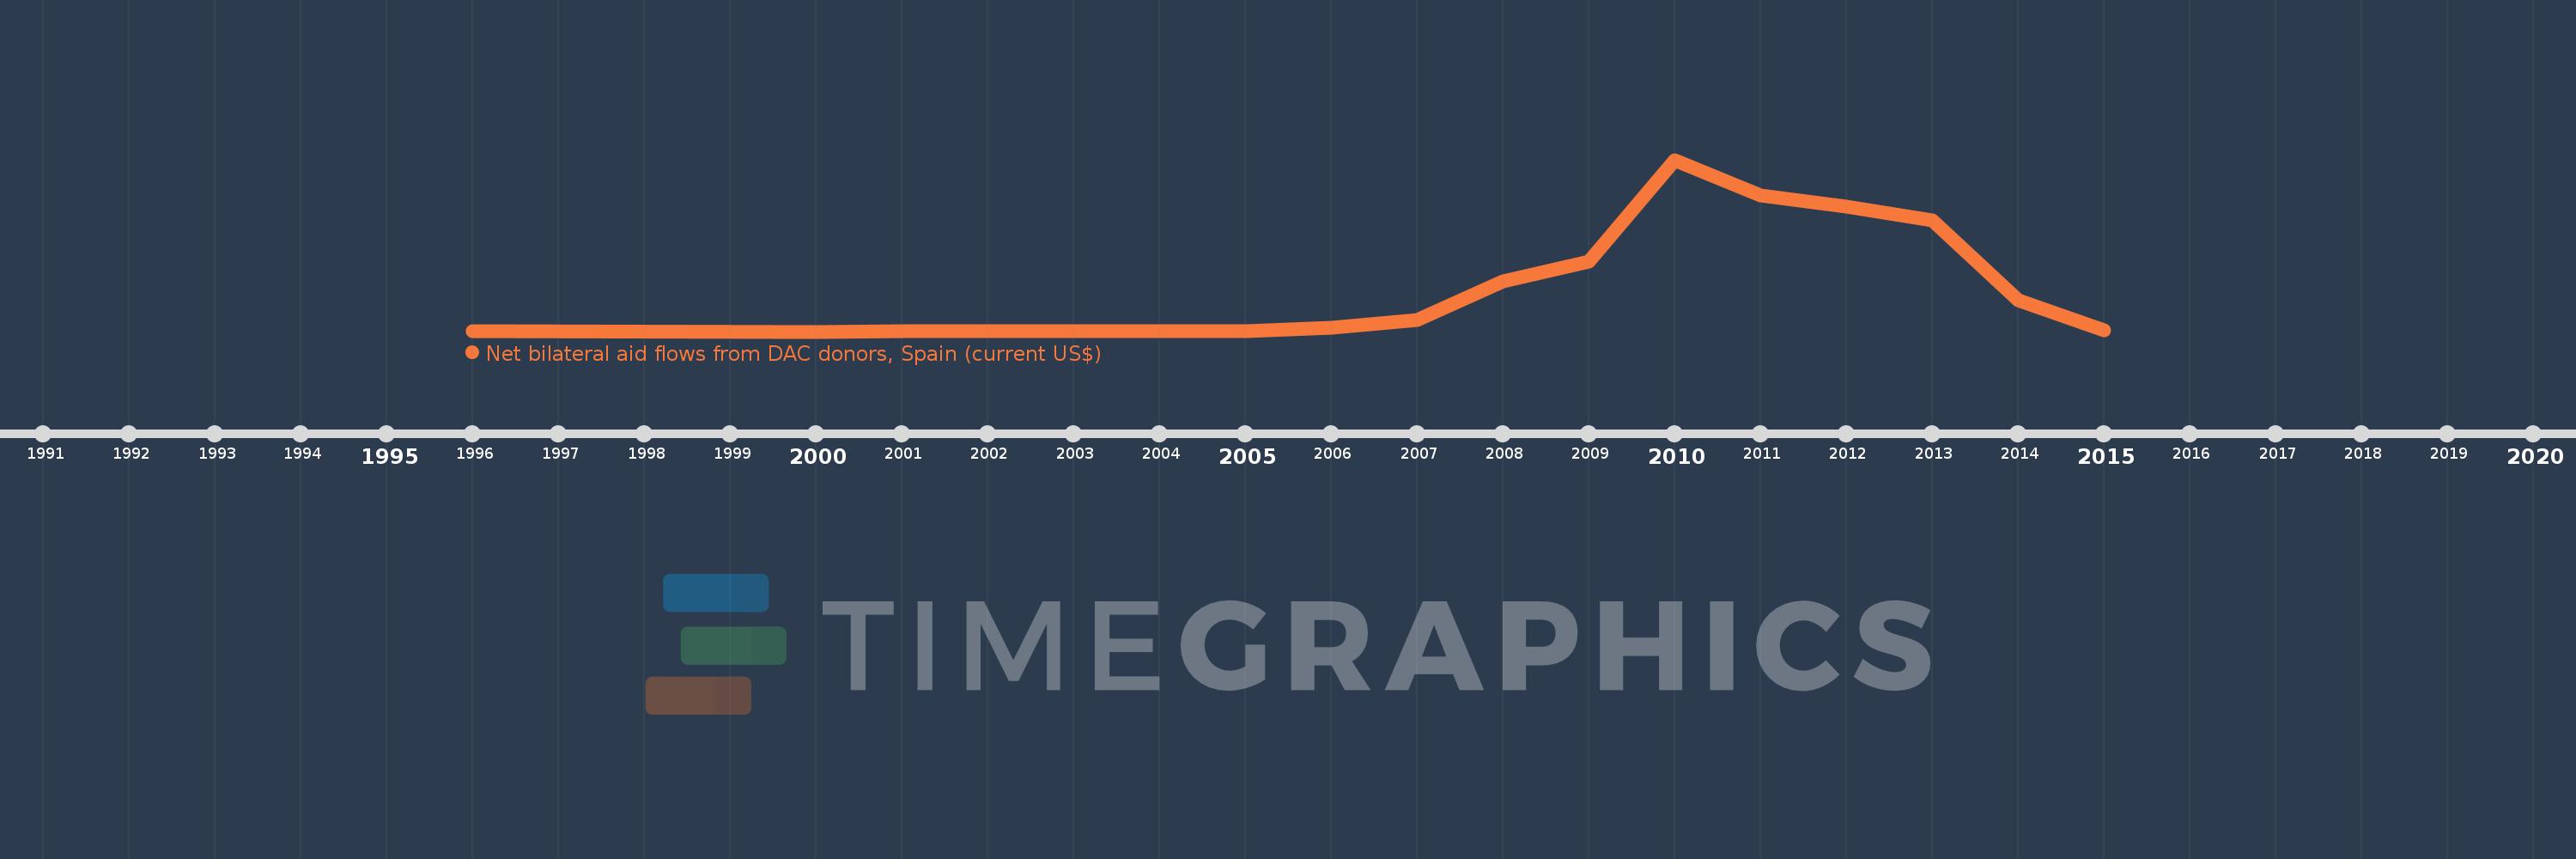
This timeline shows a graph from 1996 to 2015 of Cambodia. No data until 1995. Number of actual observations by date: 17.
Source name:
World Development Indicators
Source organization:
Development Assistance Committee of the Organisation for Economic Co-operation and Development, Geographical Distribution of Financial Flows to Developing Countries, Development Co-operation Report, and International Development Statistics database. Data are available online at: www.oecd.org/dac/stats/idsonline.
Categories, topics:
Aid Effectiveness
Last updated:
apr 23, 2017
Indicators value changes by year
Meaning:
7.122 mln
Minimum:
20.0K
jan 1, 2000
Maximum:
29.05 mln
jan 1, 2010
At the date of observation
Value
Absolute change
Change from the previous value
jan 1, 1996
120.0K
+120.0K
0.0%
jan 1, 2000
20.0K
-100.0K
-83.33%
jan 1, 2001
30.0K
+10.0K
50.0%
jan 1, 2002
60.0K
+30.0K
100.0%
jan 1, 2003
70.0K
+10.0K
16.67%
jan 1, 2004
120.0K
+50.0K
71.43%
jan 1, 2005
60.0K
-60.0K
-50.0%
jan 1, 2006
650.0K
+590.0K
983.33%
jan 1, 2007
1.97 mln
+1.32 mln
203.08%
jan 1, 2008
8.52 mln
+6.55 mln
332.49%
jan 1, 2009
11.81 mln
+3.29 mln
38.62%
jan 1, 2010
29.05 mln
+17.24 mln
145.98%
jan 1, 2011
23.08 mln
-5.97 mln
-20.55%
jan 1, 2012
21.15 mln
-1.93 mln
-8.36%
jan 1, 2013
18.76 mln
-2.39 mln
-11.3%
jan 1, 2014
5.34 mln
-13.42 mln
-71.54%
jan 1, 2015
260.0K
-5.08 mln
-95.13%
Ranking of countries by current statistics by years