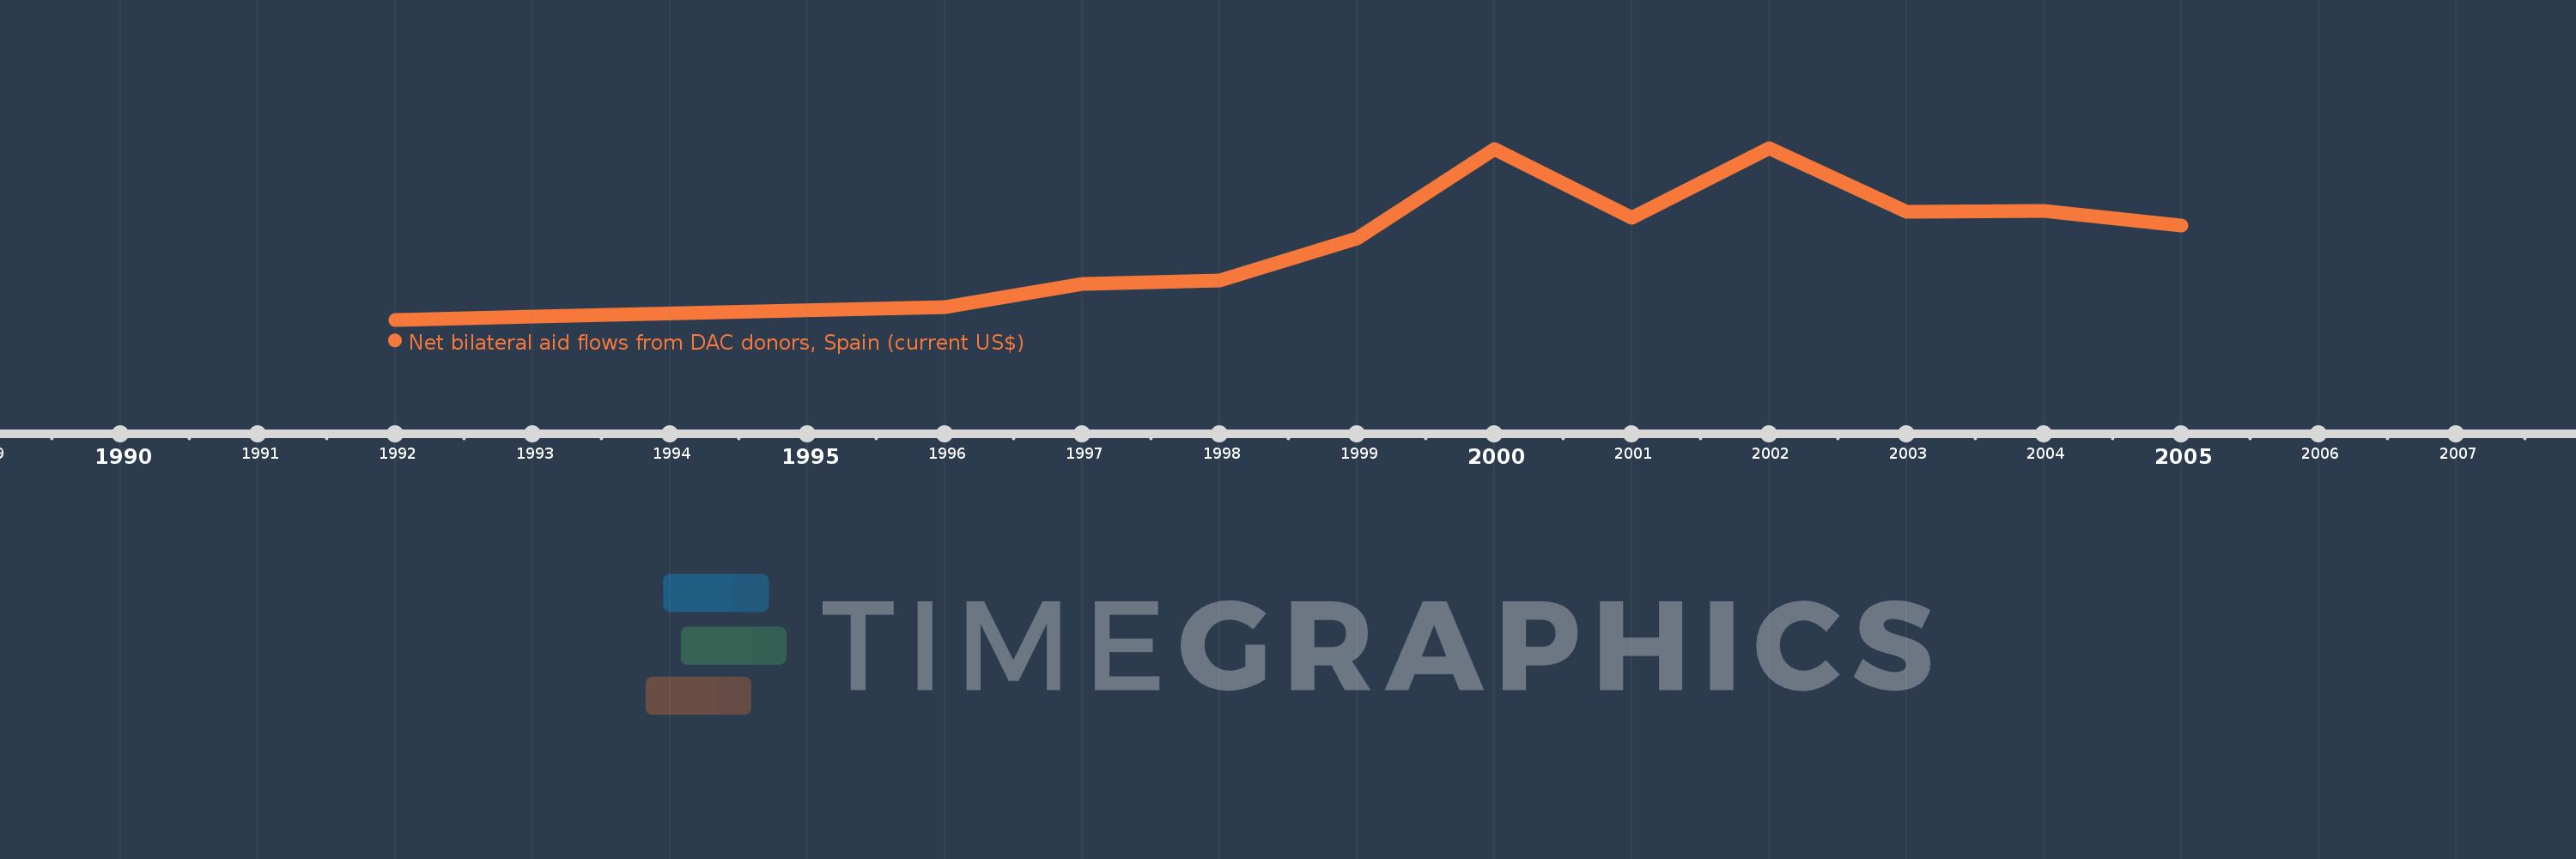
This timeline shows a graph from 1992 to 2005 of Romania. No data until 1991. Number of actual observations by date: 12.
Source name:
World Development Indicators
Source organization:
Development Assistance Committee of the Organisation for Economic Co-operation and Development, Geographical Distribution of Financial Flows to Developing Countries, Development Co-operation Report, and International Development Statistics database. Data are available online at: www.oecd.org/dac/stats/idsonline.
Categories, topics:
Aid Effectiveness
Last updated:
apr 23, 2017
Indicators value changes by year
Meaning:
1.256 mln
Minimum:
190.0K
jan 1, 1992
Maximum:
2.56 mln
jan 1, 2002
At the date of observation
Value
Absolute change
Change from the previous value
jan 1, 1992
190.0K
+190.0K
0.0%
jan 1, 1993
230.0K
+40.0K
21.05%
jan 1, 1996
360.0K
+130.0K
56.52%
jan 1, 1997
690.0K
+330.0K
91.67%
jan 1, 1998
730.0K
+40.0K
5.8%
jan 1, 1999
1.31 mln
+580.0K
79.45%
jan 1, 2000
2.54 mln
+1.23 mln
93.89%
jan 1, 2001
1.6 mln
-940.0K
-37.01%
jan 1, 2002
2.56 mln
+960.0K
60.0%
jan 1, 2003
1.68 mln
-880.0K
-34.38%
jan 1, 2004
1.69 mln
+10.0K
0.6%
jan 1, 2005
1.49 mln
-200.0K
-11.83%
Ranking of countries by current statistics by years