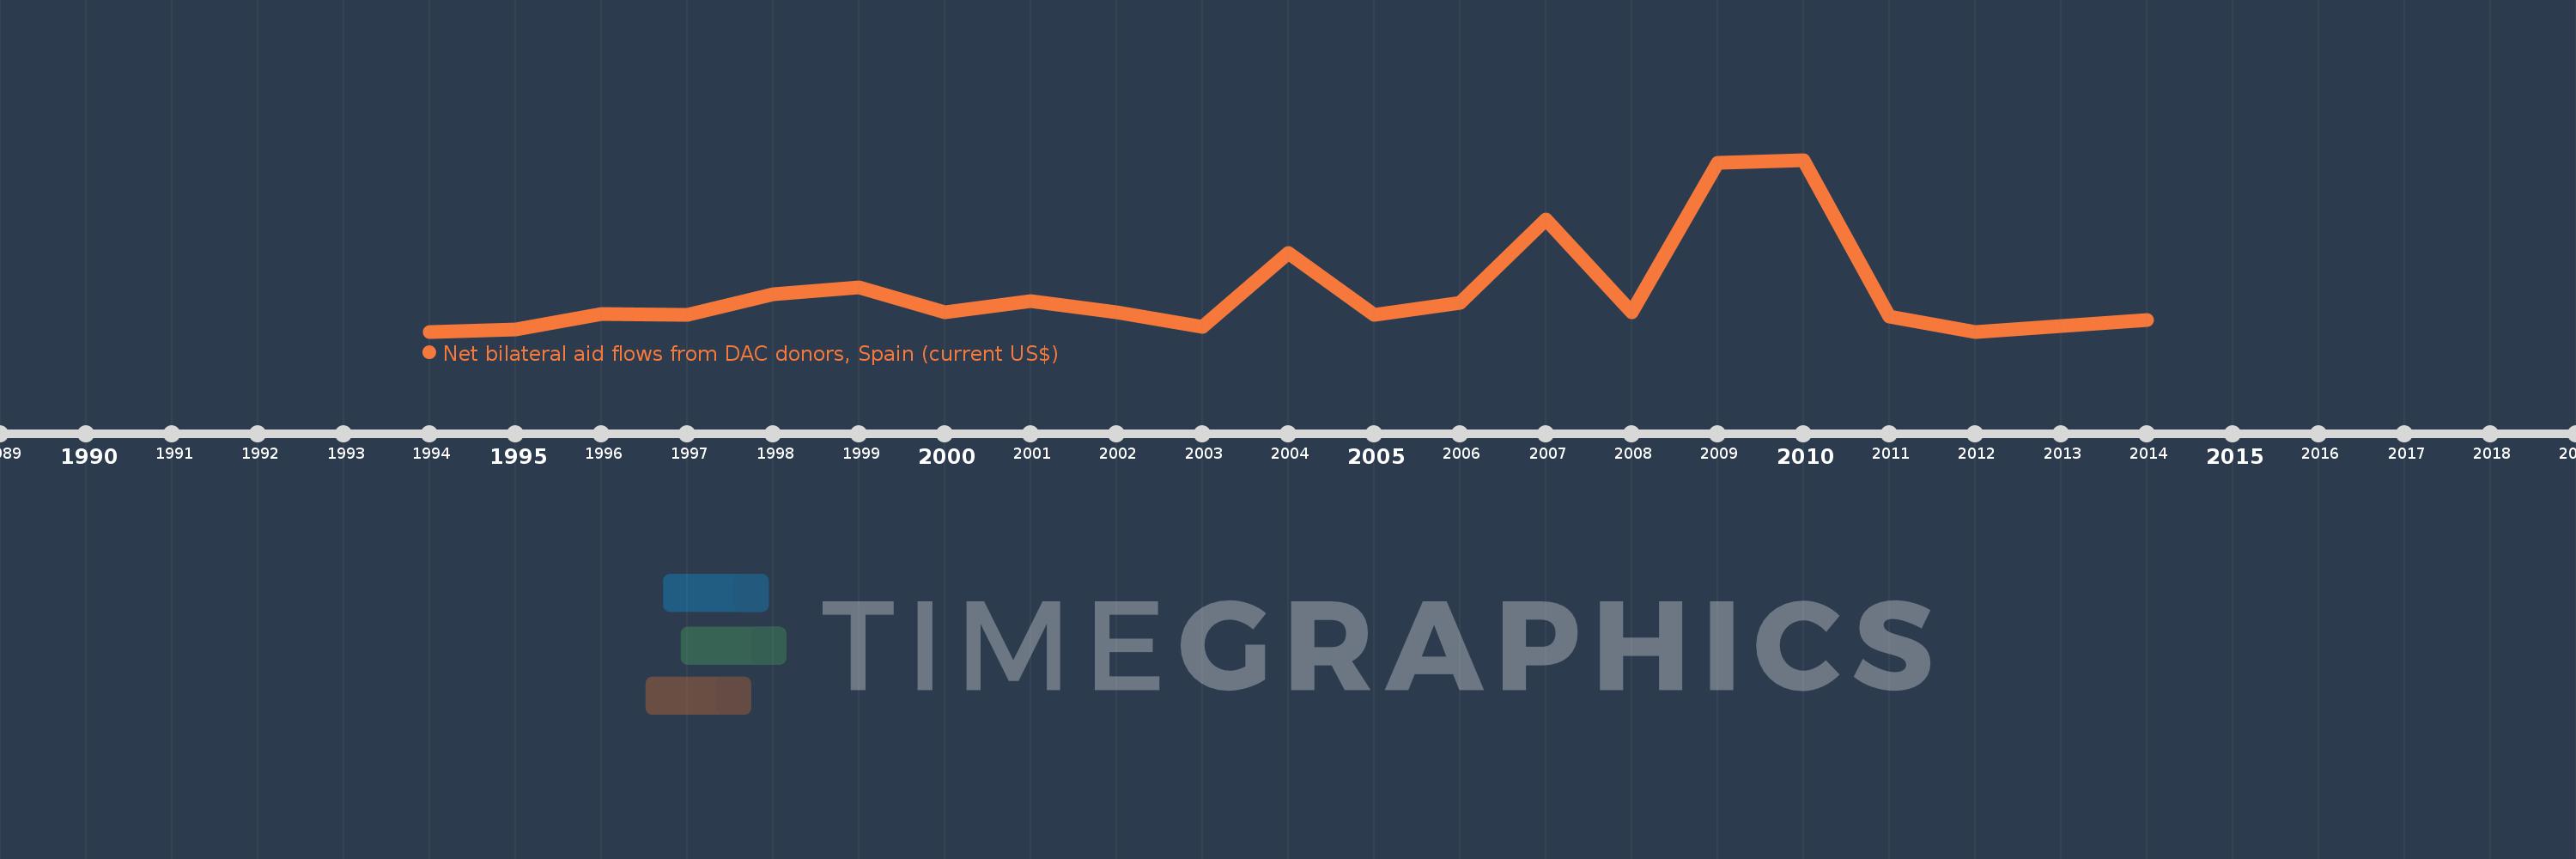
This timeline shows a graph from 1994 to 2014 of Eritrea. No data until 1993. Number of actual observations by date: 20.
Source name:
World Development Indicators
Source organization:
Development Assistance Committee of the Organisation for Economic Co-operation and Development, Geographical Distribution of Financial Flows to Developing Countries, Development Co-operation Report, and International Development Statistics database. Data are available online at: www.oecd.org/dac/stats/idsonline.
Categories, topics:
Aid Effectiveness
Last updated:
apr 23, 2017
Indicators value changes by year
Meaning:
445.0K
Minimum:
30.0K
jan 1, 1994
Maximum:
1.78 mln
jan 1, 2010
At the date of observation
Value
Absolute change
Change from the previous value
jan 1, 1994
30.0K
+30.0K
0.0%
jan 1, 1995
50.0K
+20.0K
66.67%
jan 1, 1996
210.0K
+160.0K
320.0%
jan 1, 1997
200.0K
-10.0K
-4.76%
jan 1, 1998
410.0K
+210.0K
105.0%
jan 1, 1999
480.0K
+70.0K
17.07%
jan 1, 2000
230.0K
-250.0K
-52.08%
jan 1, 2001
340.0K
+110.0K
47.83%
jan 1, 2002
230.0K
-110.0K
-32.35%
jan 1, 2003
80.0K
-150.0K
-65.22%
jan 1, 2004
830.0K
+750.0K
937.5%
jan 1, 2005
200.0K
-630.0K
-75.9%
jan 1, 2006
320.0K
+120.0K
60.0%
jan 1, 2007
1.17 mln
+850.0K
265.63%
jan 1, 2008
230.0K
-940.0K
-80.34%
jan 1, 2009
1.75 mln
+1.52 mln
660.87%
jan 1, 2010
1.78 mln
+30.0K
1.71%
jan 1, 2011
180.0K
-1.6 mln
-89.89%
jan 1, 2012
30.0K
-150.0K
-83.33%
jan 1, 2014
150.0K
+120.0K
400.0%
Ranking of countries by current statistics by years