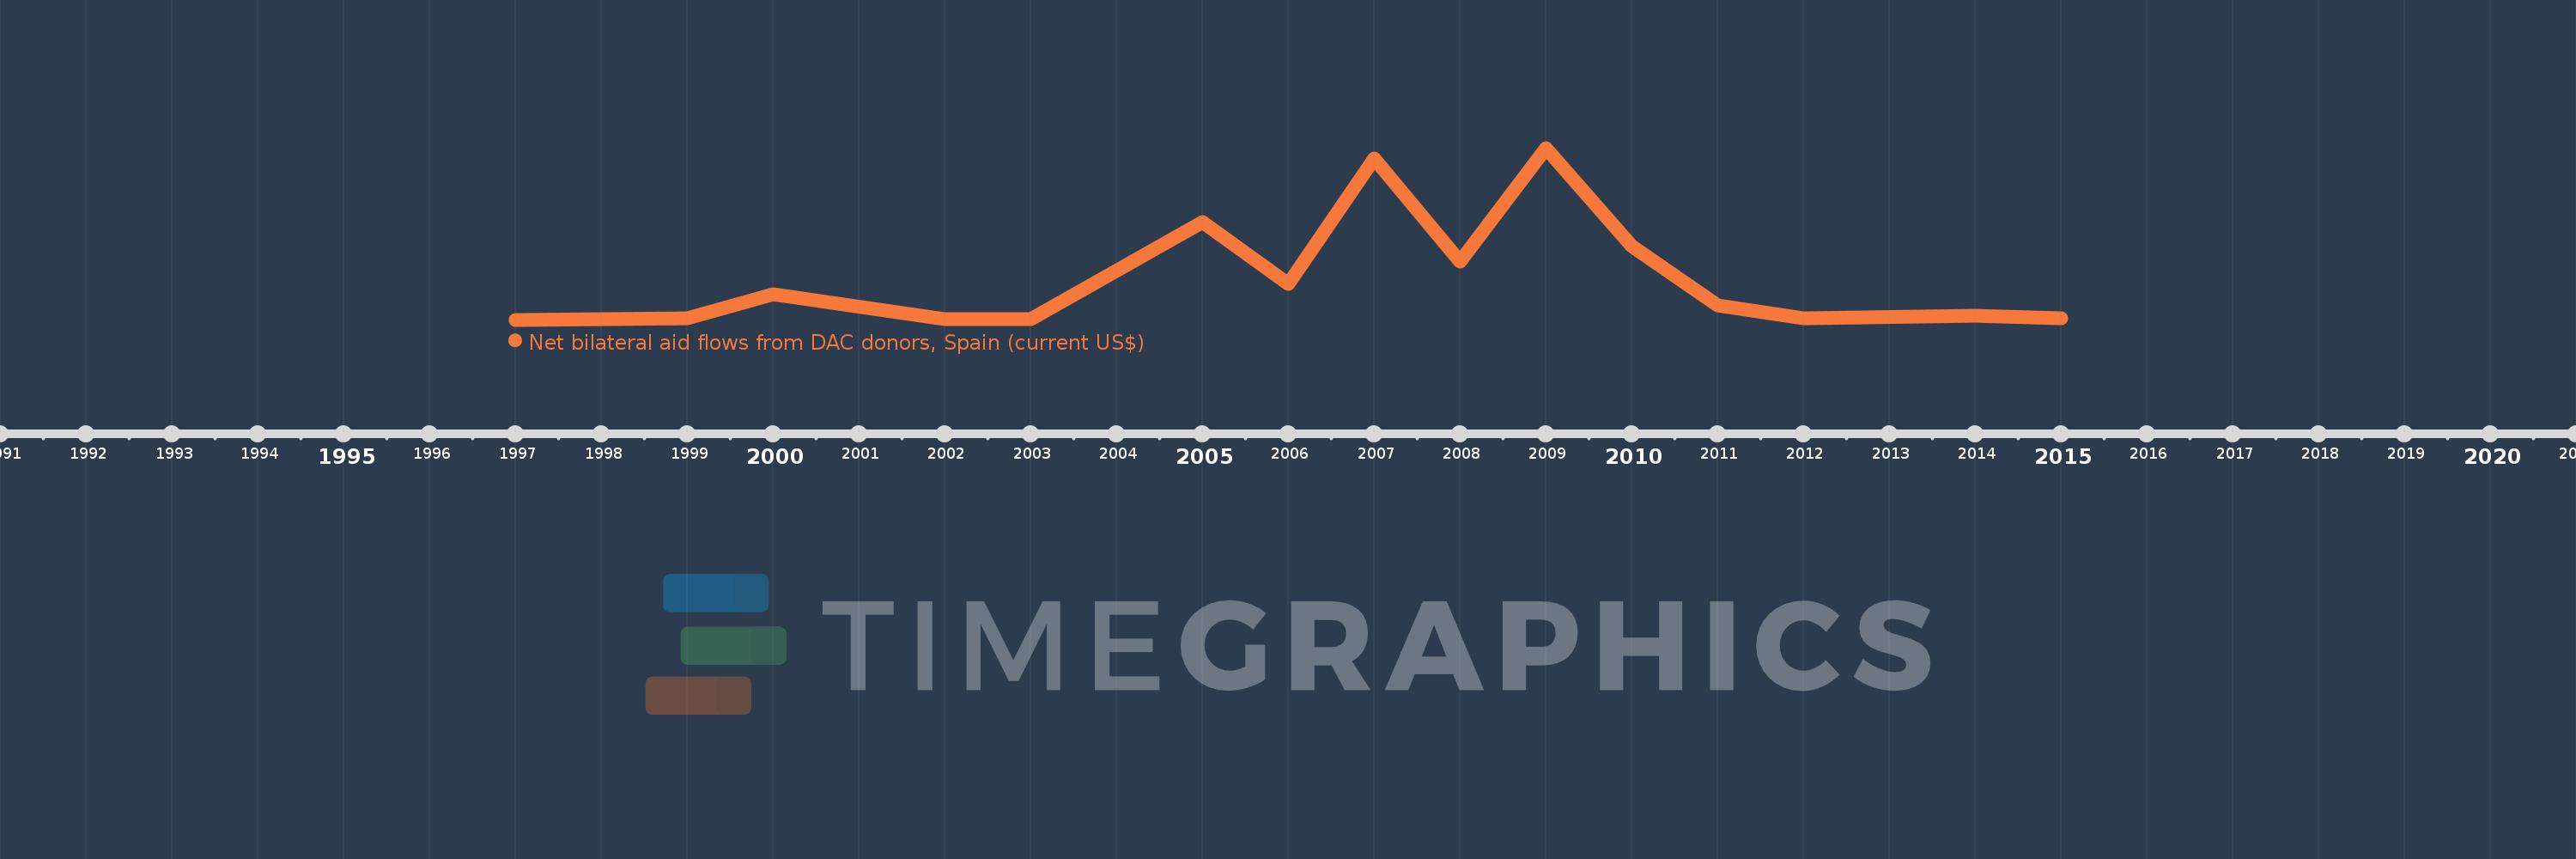
This timeline shows a graph from 1997 to 2015 of Macedonia, FYR. No data until 1996. Number of actual observations by date: 15.
Source name:
World Development Indicators
Source organization:
Development Assistance Committee of the Organisation for Economic Co-operation and Development, Geographical Distribution of Financial Flows to Developing Countries, Development Co-operation Report, and International Development Statistics database. Data are available online at: www.oecd.org/dac/stats/idsonline.
Categories, topics:
Aid Effectiveness
Last updated:
apr 23, 2017
Indicators value changes by year
Meaning:
1.029 mln
Minimum:
10.0K
jan 1, 1997
Maximum:
4.07 mln
jan 1, 2009
At the date of observation
Value
Absolute change
Change from the previous value
jan 1, 1997
10.0K
+10.0K
0.0%
jan 1, 1999
40.0K
+30.0K
300.0%
jan 1, 2000
610.0K
+570.0K
1.43K%
jan 1, 2002
20.0K
-590.0K
-96.72%
jan 1, 2003
20.0K
0.0
0.0%
jan 1, 2005
2.31 mln
+2.29 mln
11.45K%
jan 1, 2006
850.0K
-1.46 mln
-63.2%
jan 1, 2007
3.82 mln
+2.97 mln
349.41%
jan 1, 2008
1.38 mln
-2.44 mln
-63.87%
jan 1, 2009
4.07 mln
+2.69 mln
194.93%
jan 1, 2010
1.75 mln
-2.32 mln
-57.0%
jan 1, 2011
350.0K
-1.4 mln
-80.0%
jan 1, 2012
50.0K
-300.0K
-85.71%
jan 1, 2014
110.0K
+60.0K
120.0%
jan 1, 2015
50.0K
-60.0K
-54.55%
Ranking of countries by current statistics by years