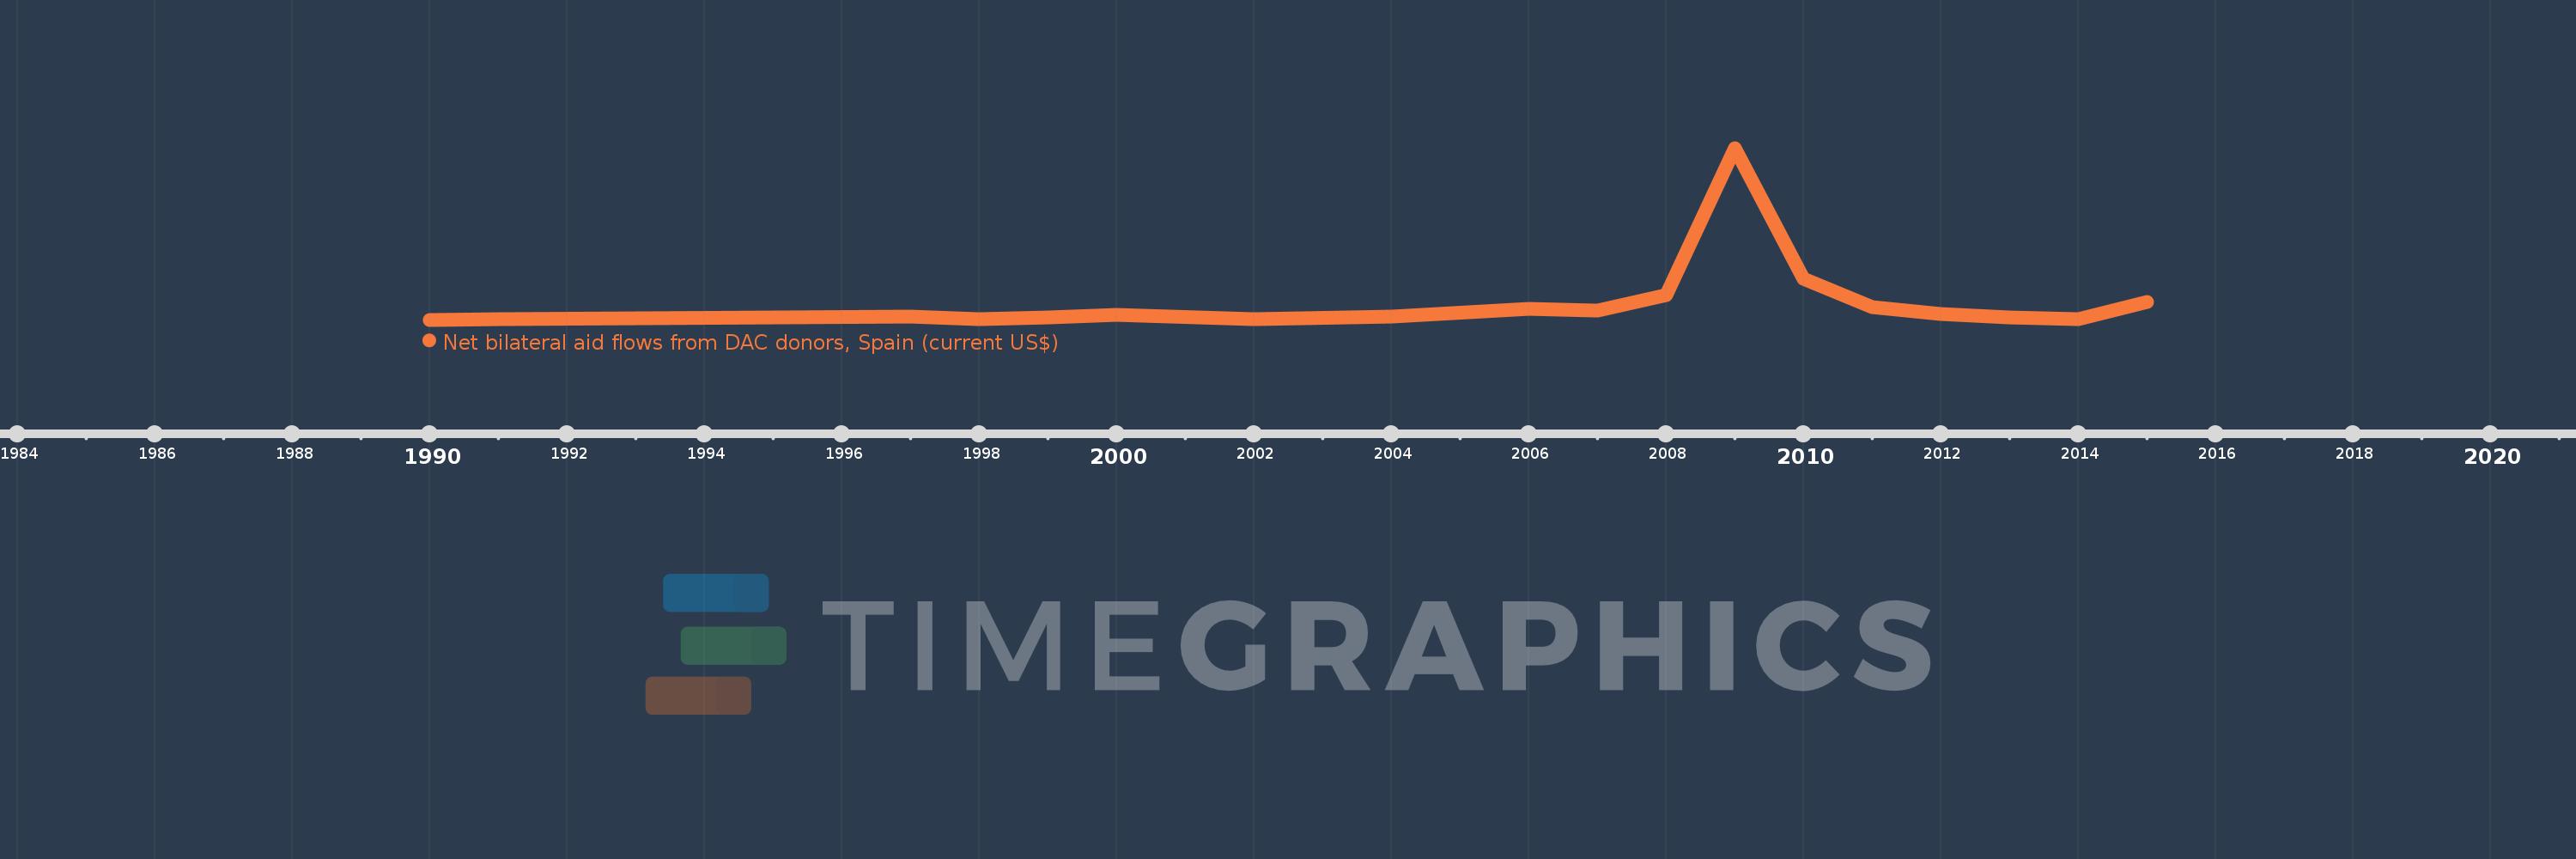
This timeline shows a graph from 1990 to 2015 of Liberia. No data until 1989. Number of actual observations by date: 18.
Source name:
World Development Indicators
Source organization:
Development Assistance Committee of the Organisation for Economic Co-operation and Development, Geographical Distribution of Financial Flows to Developing Countries, Development Co-operation Report, and International Development Statistics database. Data are available online at: www.oecd.org/dac/stats/idsonline.
Categories, topics:
Aid Effectiveness
Last updated:
apr 23, 2017
Indicators value changes by year
Meaning:
2.465 mln
Minimum:
20.0K
jan 1, 1990
Maximum:
24.29 mln
jan 1, 2009
At the date of observation
Value
Absolute change
Change from the previous value
jan 1, 1990
20.0K
+20.0K
0.0%
jan 1, 1991
100.0K
+80.0K
400.0%
jan 1, 1997
450.0K
+350.0K
350.0%
jan 1, 1998
150.0K
-300.0K
-66.67%
jan 1, 1999
330.0K
+180.0K
120.0%
jan 1, 2000
710.0K
+380.0K
115.15%
jan 1, 2002
110.0K
-600.0K
-84.51%
jan 1, 2004
460.0K
+350.0K
318.18%
jan 1, 2006
1.53 mln
+1.07 mln
232.61%
jan 1, 2007
1.26 mln
-270.0K
-17.65%
jan 1, 2008
3.55 mln
+2.29 mln
181.75%
jan 1, 2009
24.29 mln
+20.74 mln
584.23%
jan 1, 2010
5.75 mln
-18.54 mln
-76.33%
jan 1, 2011
1.83 mln
-3.92 mln
-68.17%
jan 1, 2012
840.0K
-990.0K
-54.1%
jan 1, 2013
380.0K
-460.0K
-54.76%
jan 1, 2014
70.0K
-310.0K
-81.58%
jan 1, 2015
2.54 mln
+2.47 mln
3.53K%
Ranking of countries by current statistics by years