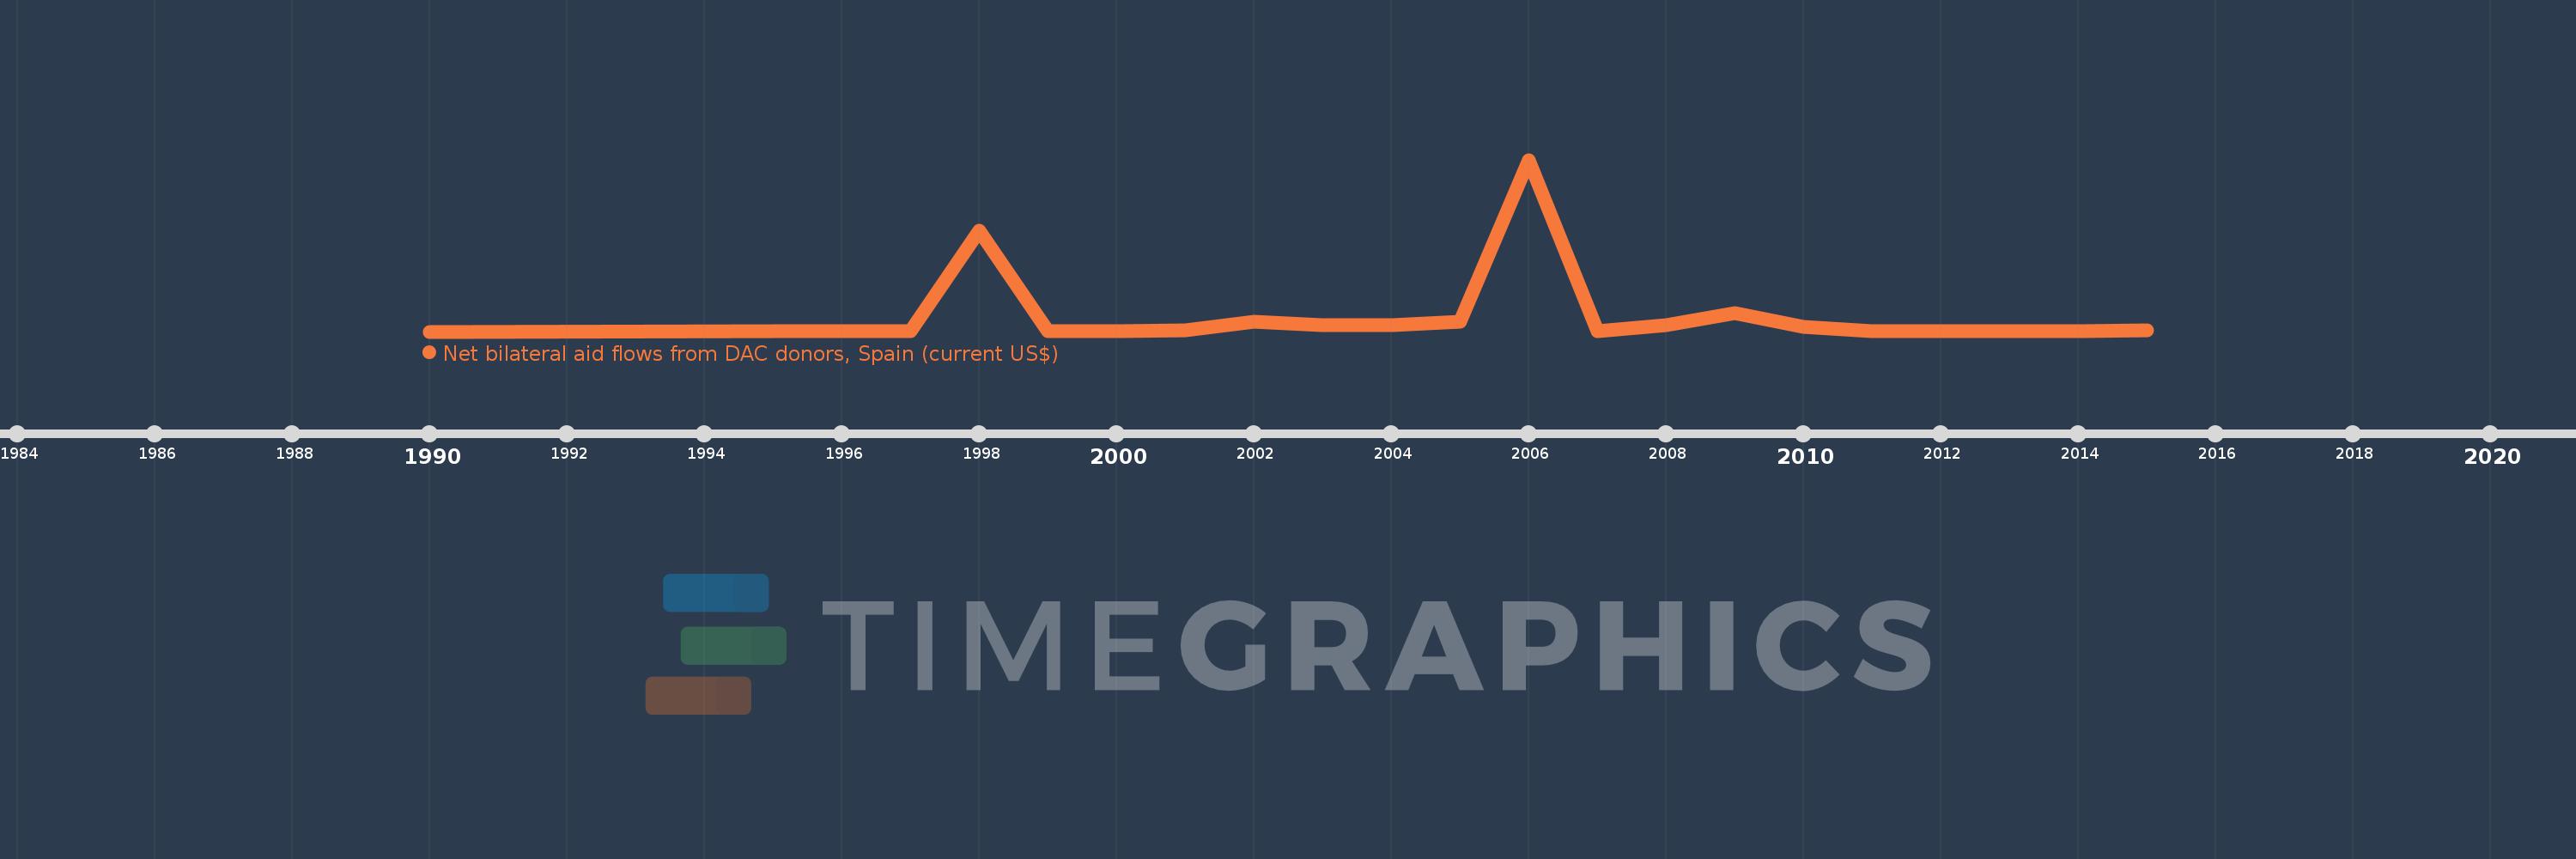
This timeline shows a graph from 1990 to 2015 of Madagascar. No data until 1989. Number of actual observations by date: 21.
Source name:
World Development Indicators
Source organization:
Development Assistance Committee of the Organisation for Economic Co-operation and Development, Geographical Distribution of Financial Flows to Developing Countries, Development Co-operation Report, and International Development Statistics database. Data are available online at: www.oecd.org/dac/stats/idsonline.
Categories, topics:
Aid Effectiveness
Last updated:
apr 23, 2017
Indicators value changes by year
Meaning:
12.765 mln
Minimum:
10.0K
jan 1, 1990
Maximum:
135.44 mln
jan 1, 2006
At the date of observation
Value
Absolute change
Change from the previous value
jan 1, 1990
10.0K
+10.0K
0.0%
jan 1, 1995
60.0K
+50.0K
500.0%
jan 1, 1997
20.0K
-40.0K
-66.67%
jan 1, 1998
79.5 mln
+79.48 mln
397.4K%
jan 1, 1999
220.0K
-79.28 mln
-99.72%
jan 1, 2000
220.0K
0.0
0.0%
jan 1, 2001
1.06 mln
+840.0K
381.82%
jan 1, 2002
7.73 mln
+6.67 mln
629.25%
jan 1, 2003
4.86 mln
-2.87 mln
-37.13%
jan 1, 2004
5.26 mln
+400.0K
8.23%
jan 1, 2005
7.95 mln
+2.69 mln
51.14%
jan 1, 2006
135.44 mln
+127.49 mln
1.6K%
jan 1, 2007
160.0K
-135.28 mln
-99.88%
jan 1, 2008
5.39 mln
+5.23 mln
3.27K%
jan 1, 2009
14.57 mln
+9.18 mln
170.32%
jan 1, 2010
4.05 mln
-10.52 mln
-72.2%
jan 1, 2011
340.0K
-3.71 mln
-91.6%
jan 1, 2012
160.0K
-180.0K
-52.94%
jan 1, 2013
220.0K
+60.0K
37.5%
jan 1, 2014
40.0K
-180.0K
-81.82%
jan 1, 2015
810.0K
+770.0K
1.93K%
Ranking of countries by current statistics by years