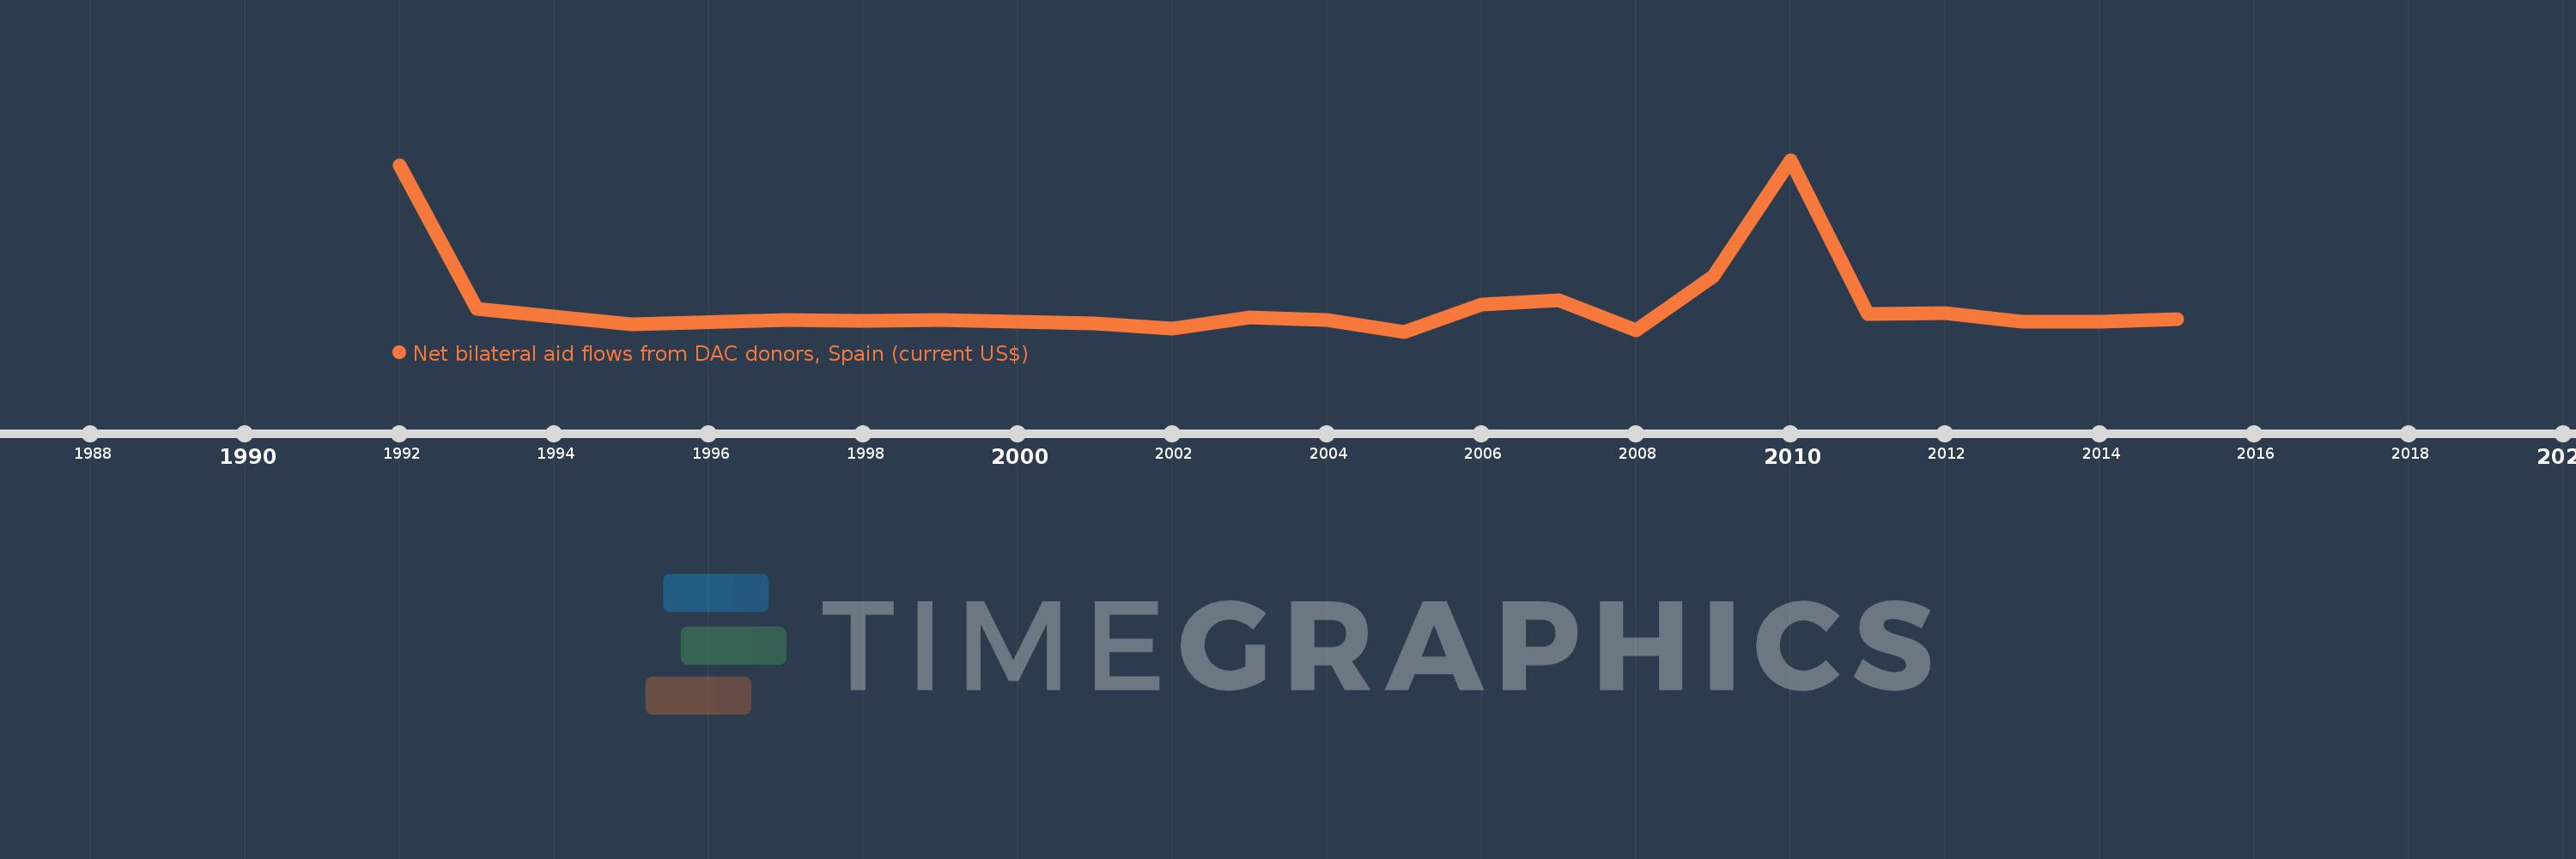
This timeline shows a graph from 1992 to 2015 of Malawi. No data until 1991. Number of actual observations by date: 22.
Source name:
World Development Indicators
Source organization:
Development Assistance Committee of the Organisation for Economic Co-operation and Development, Geographical Distribution of Financial Flows to Developing Countries, Development Co-operation Report, and International Development Statistics database. Data are available online at: www.oecd.org/dac/stats/idsonline.
Categories, topics:
Aid Effectiveness
Last updated:
apr 23, 2017
Indicators value changes by year
Meaning:
1.299 mln
Minimum:
-400.0K
jan 1, 2005
Maximum:
9.81 mln
jan 1, 2010
At the date of observation
Value
Absolute change
Change from the previous value
jan 1, 1992
9.46 mln
+9.46 mln
0.0%
jan 1, 1993
940.0K
-8.52 mln
-90.06%
jan 1, 1995
10.0K
-930.0K
-98.94%
jan 1, 1997
280.0K
+270.0K
2.7K%
jan 1, 1998
260.0K
-20.0K
-7.14%
jan 1, 1999
290.0K
+30.0K
11.54%
jan 1, 2000
180.0K
-110.0K
-37.93%
jan 1, 2001
60.0K
-120.0K
-66.67%
jan 1, 2002
-230.0K
-290.0K
-483.33%
jan 1, 2003
420.0K
+650.0K
-282.61%
jan 1, 2004
270.0K
-150.0K
-35.71%
jan 1, 2005
-400.0K
-670.0K
-248.15%
jan 1, 2006
1.19 mln
+1.59 mln
-397.5%
jan 1, 2007
1.44 mln
+250.0K
21.01%
jan 1, 2008
-320.0K
-1.76 mln
-122.22%
jan 1, 2009
2.9 mln
+3.22 mln
-1.01K%
jan 1, 2010
9.81 mln
+6.91 mln
238.28%
jan 1, 2011
630.0K
-9.18 mln
-93.58%
jan 1, 2012
700.0K
+70.0K
11.11%
jan 1, 2013
200.0K
-500.0K
-71.43%
jan 1, 2014
170.0K
-30.0K
-15.0%
jan 1, 2015
320.0K
+150.0K
88.24%
Ranking of countries by current statistics by years