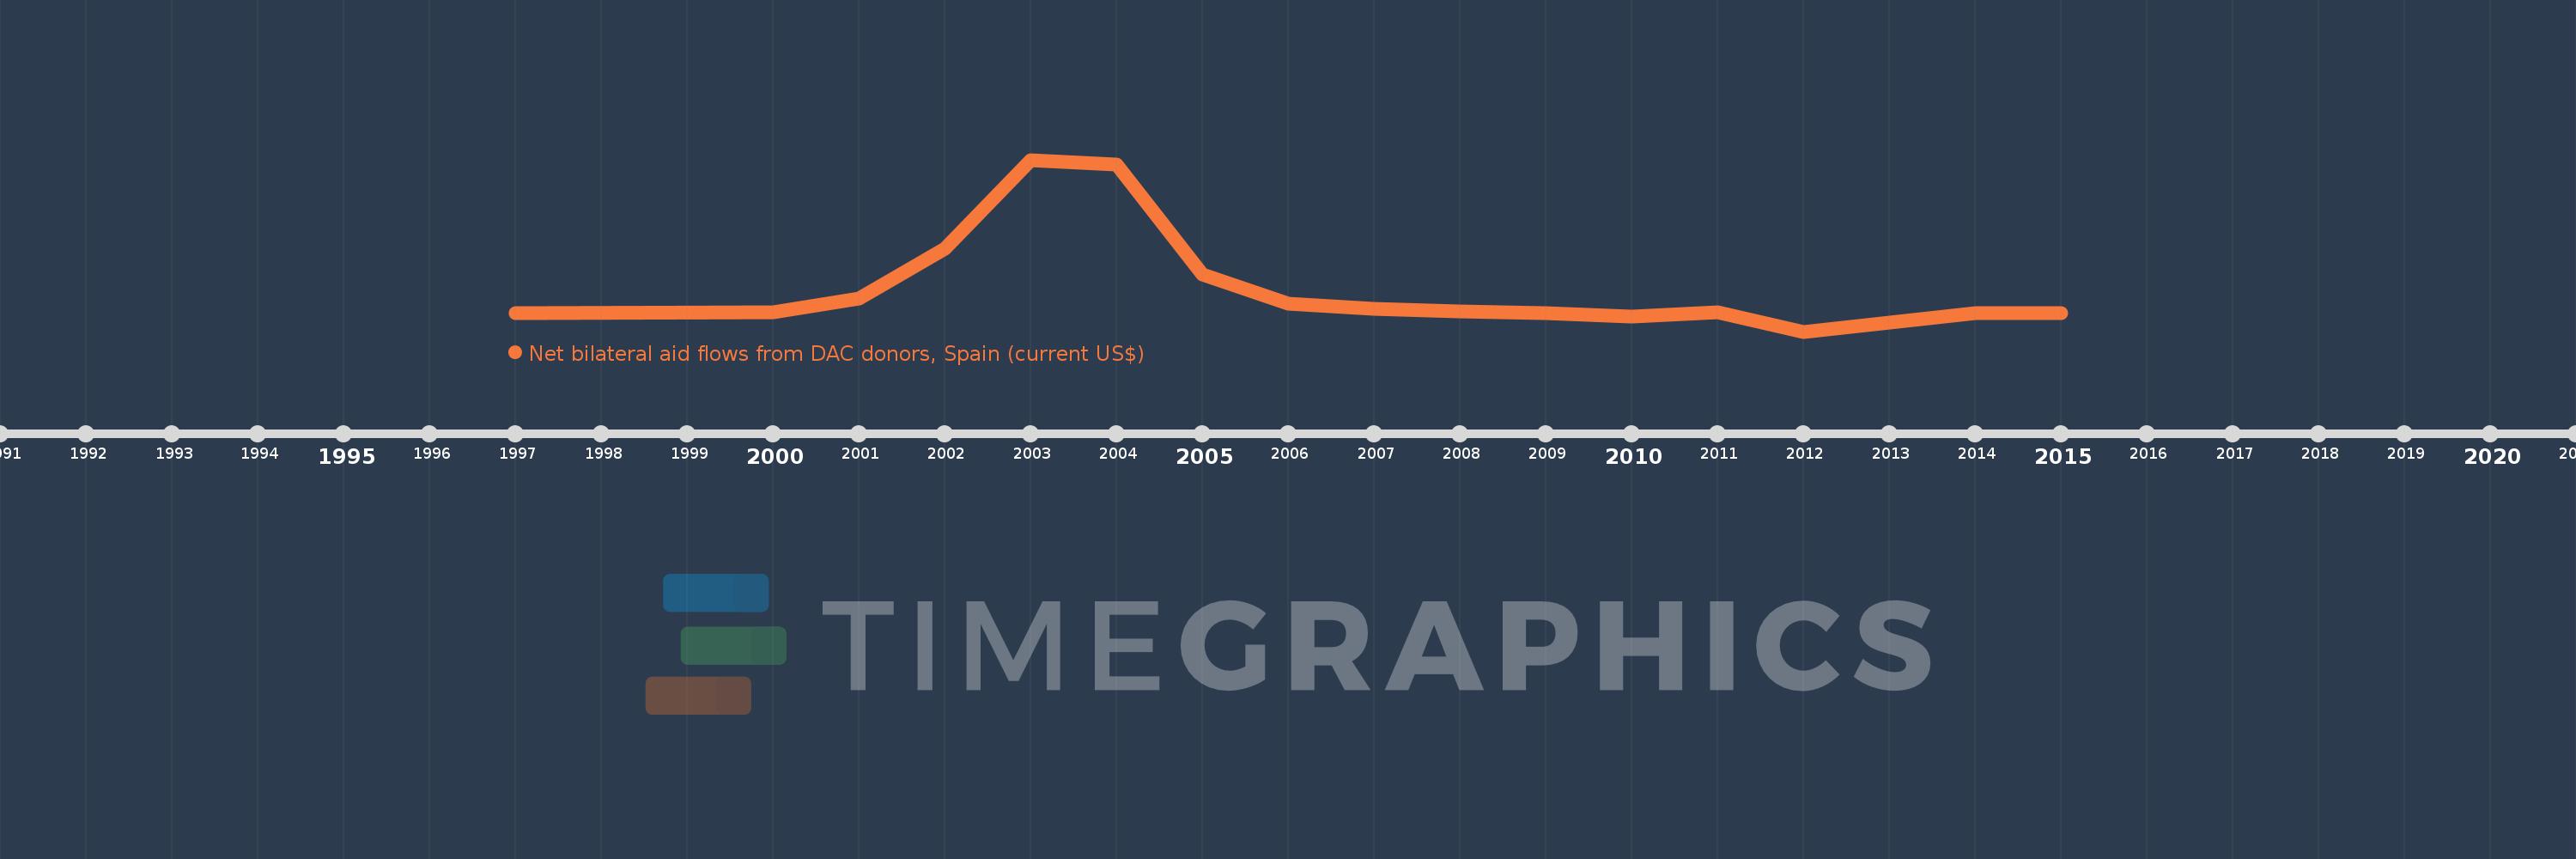
This timeline shows a graph from 1997 to 2015 of Kazakhstan. No data until 1996. Number of actual observations by date: 16.
Source name:
World Development Indicators
Source organization:
Development Assistance Committee of the Organisation for Economic Co-operation and Development, Geographical Distribution of Financial Flows to Developing Countries, Development Co-operation Report, and International Development Statistics database. Data are available online at: www.oecd.org/dac/stats/idsonline.
Categories, topics:
Aid Effectiveness
Last updated:
apr 23, 2017
Indicators value changes by year
Meaning:
2.991 mln
Minimum:
-2.06 mln
jan 1, 2012
Maximum:
17.5 mln
jan 1, 2003
At the date of observation
Value
Absolute change
Change from the previous value
jan 1, 1997
10.0K
+10.0K
0.0%
jan 1, 2000
120.0K
+110.0K
1.1K%
jan 1, 2001
1.69 mln
+1.57 mln
1.31K%
jan 1, 2002
7.38 mln
+5.69 mln
336.69%
jan 1, 2003
17.5 mln
+10.12 mln
137.13%
jan 1, 2004
17.0 mln
-500.0K
-2.86%
jan 1, 2005
4.49 mln
-12.51 mln
-73.59%
jan 1, 2006
1.12 mln
-3.37 mln
-75.06%
jan 1, 2007
540.0K
-580.0K
-51.79%
jan 1, 2008
250.0K
-290.0K
-53.7%
jan 1, 2009
60.0K
-190.0K
-76.0%
jan 1, 2010
-390.0K
-450.0K
-750.0%
jan 1, 2011
110.0K
+500.0K
-128.21%
jan 1, 2012
-2.06 mln
-2.17 mln
-1.97K%
jan 1, 2014
20.0K
+2.08 mln
-100.97%
jan 1, 2015
10.0K
-10.0K
-50.0%
Ranking of countries by current statistics by years