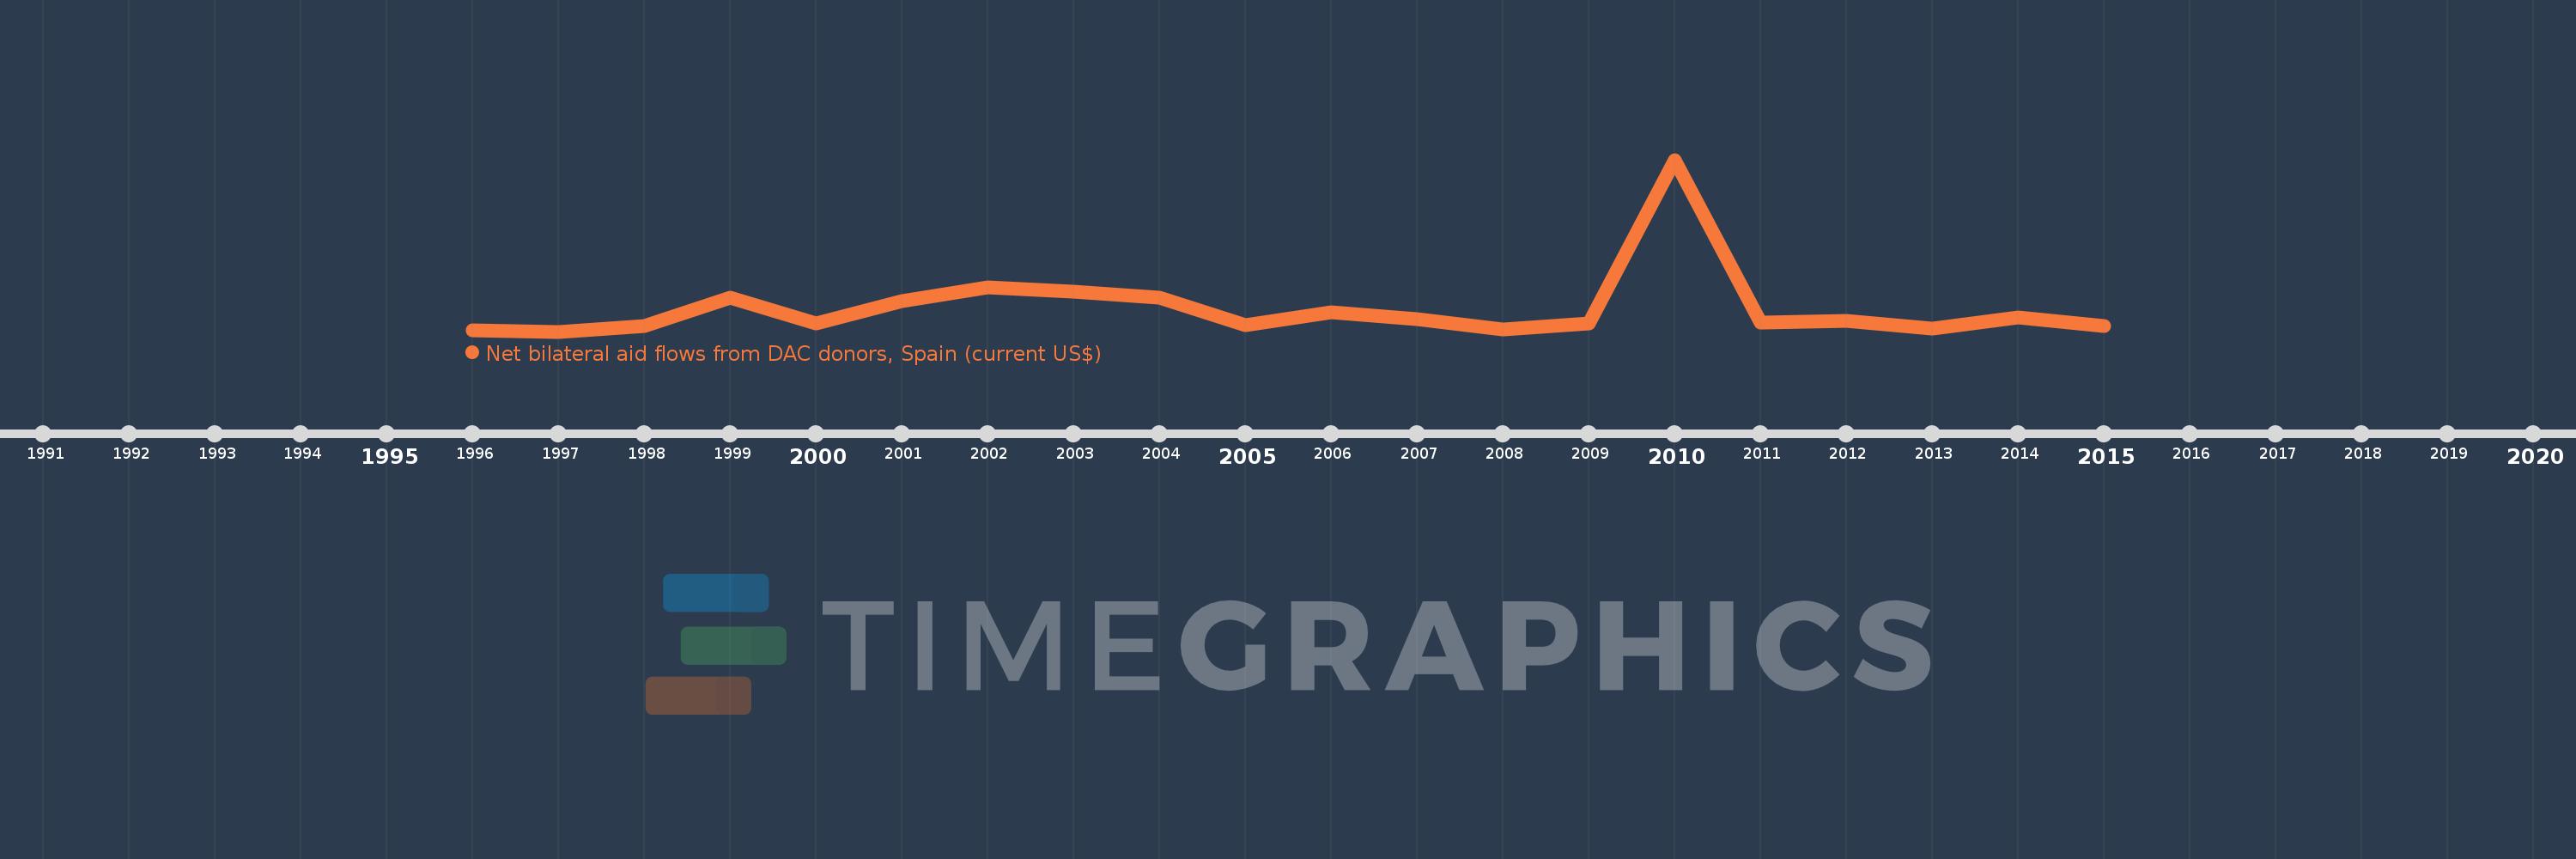
This timeline shows a graph from 1996 to 2015 of Ukraine. No data until 1995. Number of actual observations by date: 20.
Source name:
World Development Indicators
Source organization:
Development Assistance Committee of the Organisation for Economic Co-operation and Development, Geographical Distribution of Financial Flows to Developing Countries, Development Co-operation Report, and International Development Statistics database. Data are available online at: www.oecd.org/dac/stats/idsonline.
Categories, topics:
Aid Effectiveness
Last updated:
apr 23, 2017
Indicators value changes by year
Meaning:
584.5K
Minimum:
80.0K
jan 1, 1997
Maximum:
3.84 mln
jan 1, 2010
At the date of observation
Value
Absolute change
Change from the previous value
jan 1, 1996
110.0K
+110.0K
0.0%
jan 1, 1997
80.0K
-30.0K
-27.27%
jan 1, 1998
200.0K
+120.0K
150.0%
jan 1, 1999
830.0K
+630.0K
315.0%
jan 1, 2000
250.0K
-580.0K
-69.88%
jan 1, 2001
740.0K
+490.0K
196.0%
jan 1, 2002
1.05 mln
+310.0K
41.89%
jan 1, 2003
950.0K
-100.0K
-9.52%
jan 1, 2004
820.0K
-130.0K
-13.68%
jan 1, 2005
230.0K
-590.0K
-71.95%
jan 1, 2006
500.0K
+270.0K
117.39%
jan 1, 2007
360.0K
-140.0K
-28.0%
jan 1, 2008
130.0K
-230.0K
-63.89%
jan 1, 2009
260.0K
+130.0K
100.0%
jan 1, 2010
3.84 mln
+3.58 mln
1.38K%
jan 1, 2011
270.0K
-3.57 mln
-92.97%
jan 1, 2012
320.0K
+50.0K
18.52%
jan 1, 2013
150.0K
-170.0K
-53.13%
jan 1, 2014
390.0K
+240.0K
160.0%
jan 1, 2015
210.0K
-180.0K
-46.15%
Ranking of countries by current statistics by years