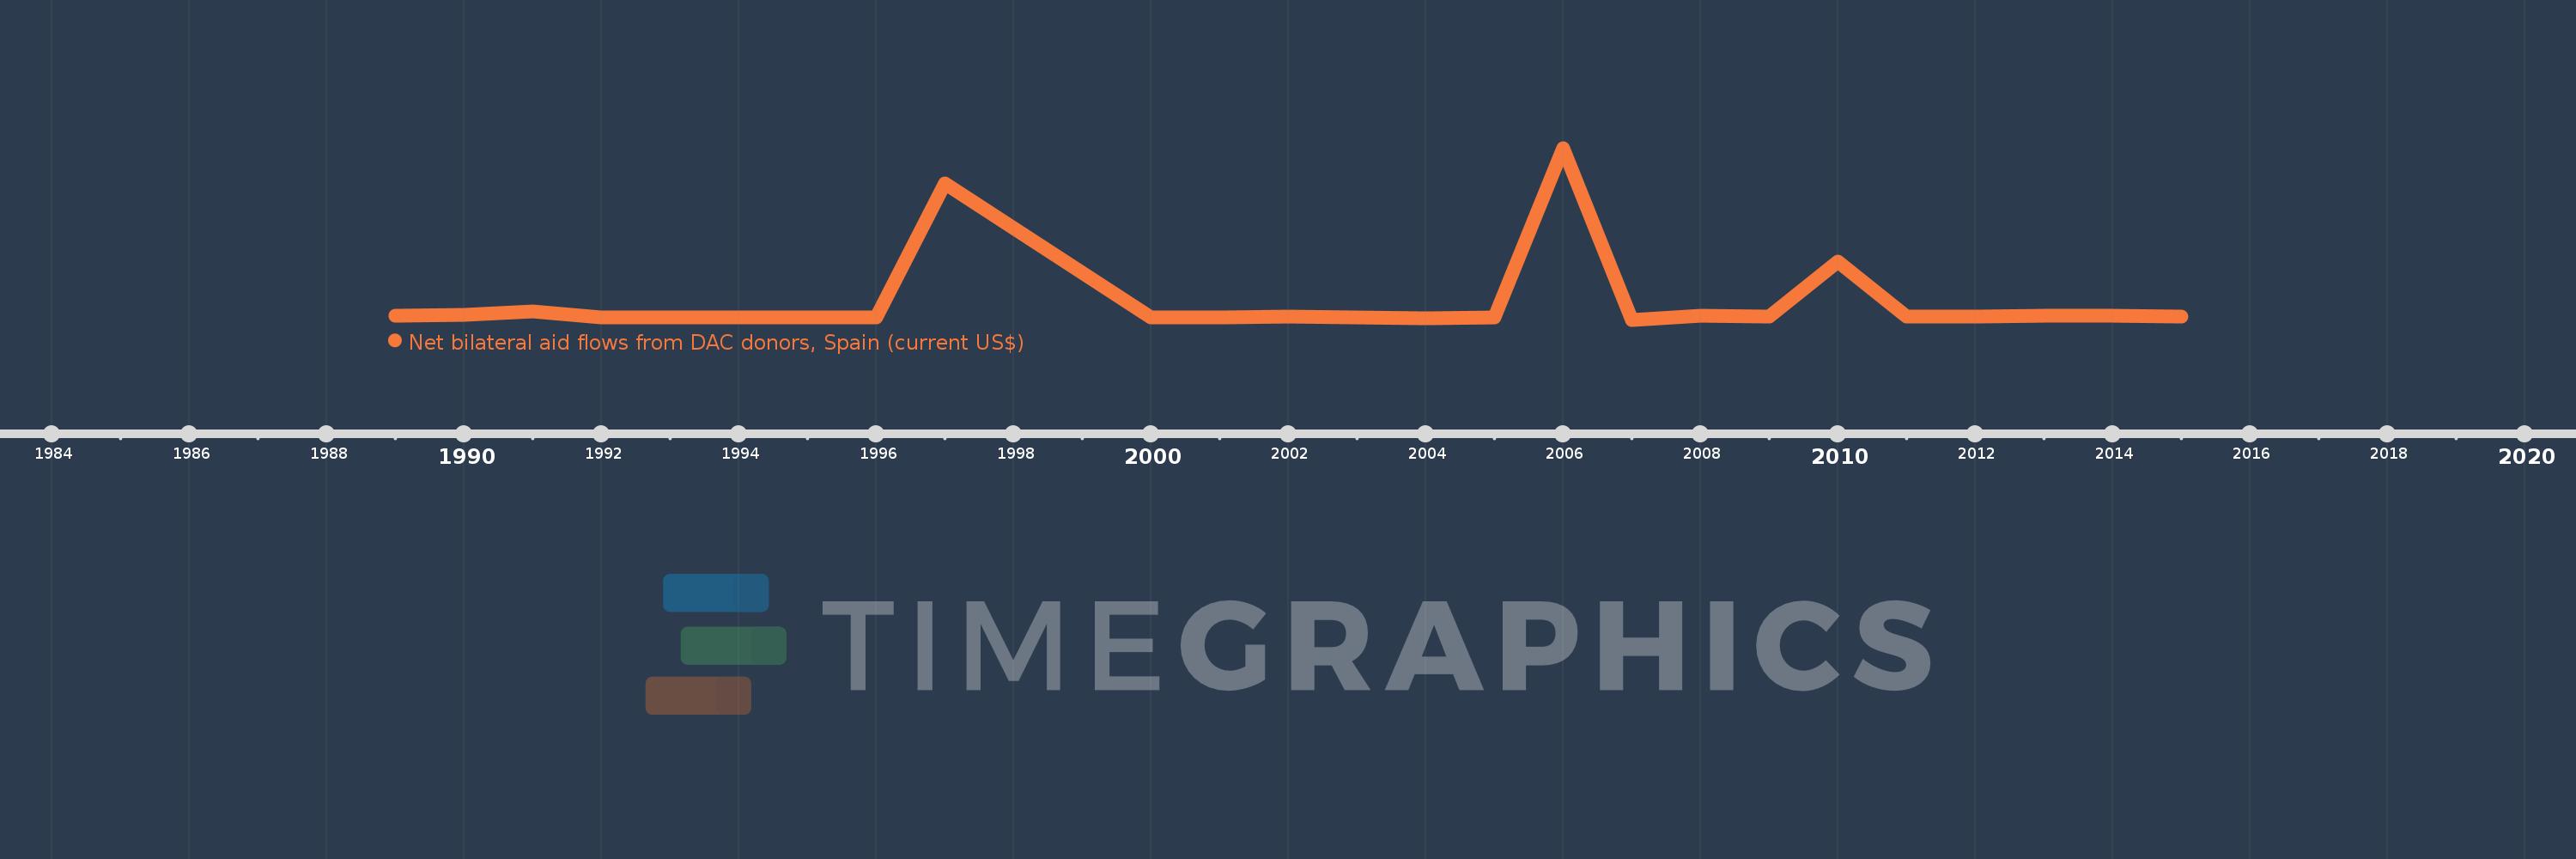
This timeline shows a graph from 1989 to 2015 of Congo, Rep.. No data until 1988. Number of actual observations by date: 21.
Source name:
World Development Indicators
Source organization:
Development Assistance Committee of the Organisation for Economic Co-operation and Development, Geographical Distribution of Financial Flows to Developing Countries, Development Co-operation Report, and International Development Statistics database. Data are available online at: www.oecd.org/dac/stats/idsonline.
Categories, topics:
Aid Effectiveness
Last updated:
apr 23, 2017
Indicators value changes by year
Meaning:
14.103 mln
Minimum:
-1.94 mln
jan 1, 2007
Maximum:
134.22 mln
jan 1, 2006
At the date of observation
Value
Absolute change
Change from the previous value
jan 1, 1989
1000.0K
+1000.0K
0.0%
jan 1, 1990
1.98 mln
+980.0K
98.0%
jan 1, 1991
4.34 mln
+2.36 mln
119.19%
jan 1, 1992
220.0K
-4.12 mln
-94.93%
jan 1, 1996
10.0K
-210.0K
-95.45%
jan 1, 1997
106.32 mln
+106.31 mln
1.06 mln%
jan 1, 2000
70.0K
-106.25 mln
-99.93%
jan 1, 2001
-310.0K
-380.0K
-542.86%
jan 1, 2002
830.0K
+1.14 mln
-367.74%
jan 1, 2004
-590.0K
-1.42 mln
-171.08%
jan 1, 2005
-270.0K
+320.0K
-54.24%
jan 1, 2006
134.22 mln
+134.49 mln
-49.81K%
jan 1, 2007
-1.94 mln
-136.16 mln
-101.45%
jan 1, 2008
970.0K
+2.91 mln
-150.0%
jan 1, 2009
680.0K
-290.0K
-29.9%
jan 1, 2010
44.35 mln
+43.67 mln
6.42K%
jan 1, 2011
490.0K
-43.86 mln
-98.9%
jan 1, 2012
520.0K
+30.0K
6.12%
jan 1, 2013
1.51 mln
+990.0K
190.38%
jan 1, 2014
1.47 mln
-40.0K
-2.65%
jan 1, 2015
300.0K
-1.17 mln
-79.59%
Ranking of countries by current statistics by years