This timeline shows a graph from 1994 to 2015 of Uzbekistan. No data until 1993. Number of actual observations by date: 17.
Source name:
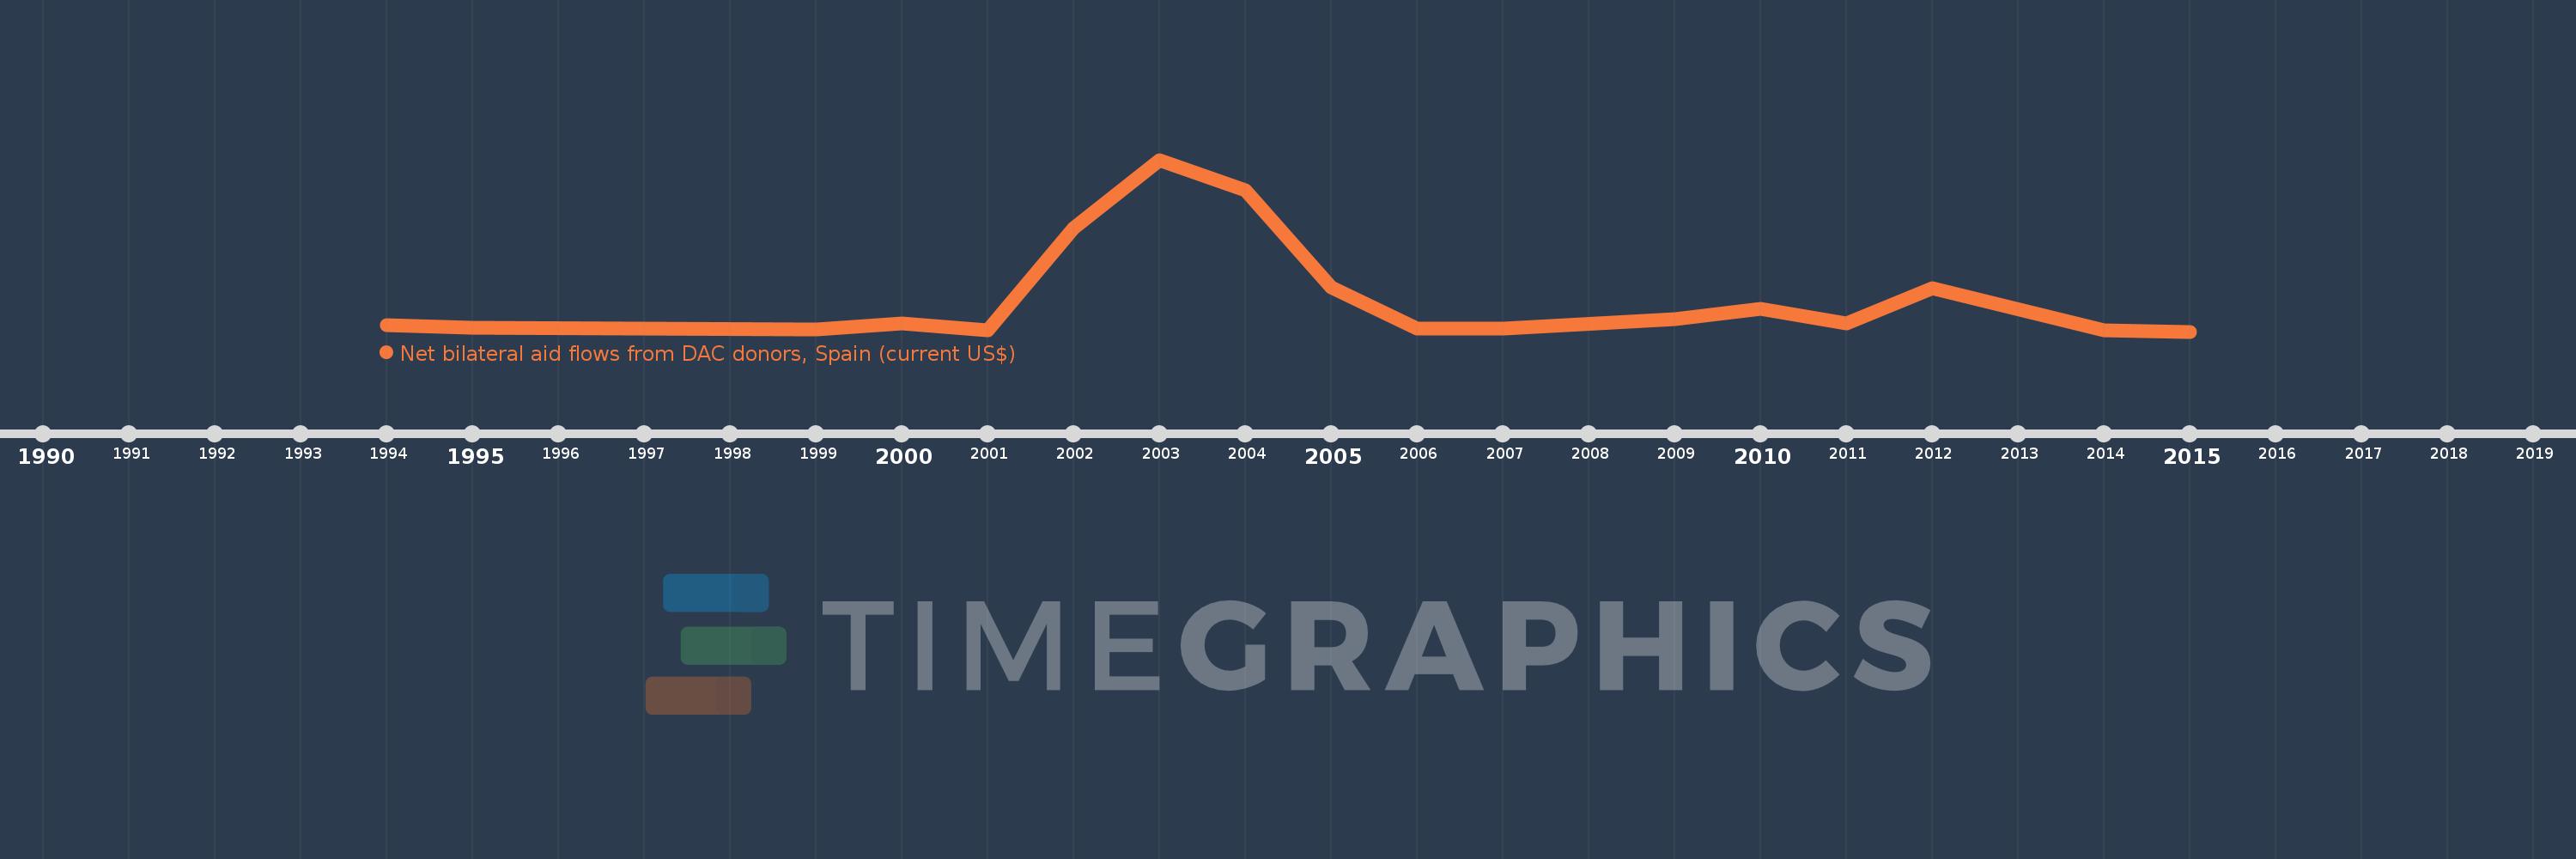
World Development Indicators
Source organization:
Development Assistance Committee of the Organisation for Economic Co-operation and Development, Geographical Distribution of Financial Flows to Developing Countries, Development Co-operation Report, and International Development Statistics database. Data are available online at: www.oecd.org/dac/stats/idsonline.
Categories, topics:
Aid Effectiveness
Last updated:
apr 23, 2017
Indicators value changes by year
Meaning:
984.118K
Minimum:
0.0
jan 1, 2015
Maximum:
4.99 mln
jan 1, 2003
At the date of observation
Value
Absolute change
Change from the previous value
jan 1, 1994
190.0K
+190.0K
0.0%
jan 1, 1995
100.0K
-90.0K
-47.37%
jan 1, 1999
70.0K
-30.0K
-30.0%
jan 1, 2000
240.0K
+170.0K
242.86%
jan 1, 2001
30.0K
-210.0K
-87.5%
jan 1, 2002
3.01 mln
+2.98 mln
9.93K%
jan 1, 2003
4.99 mln
+1.98 mln
65.78%
jan 1, 2004
4.11 mln
-880.0K
-17.64%
jan 1, 2005
1.28 mln
-2.83 mln
-68.86%
jan 1, 2006
80.0K
-1.2 mln
-93.75%
jan 1, 2007
80.0K
0.0
0.0%
jan 1, 2009
360.0K
+280.0K
350.0%
jan 1, 2010
660.0K
+300.0K
83.33%
jan 1, 2011
230.0K
-430.0K
-65.15%
jan 1, 2012
1.27 mln
+1.04 mln
452.17%
jan 1, 2014
30.0K
-1.24 mln
-97.64%
jan 1, 2015
0.0
-30.0K
-100.0%
Ranking of countries by current statistics by years