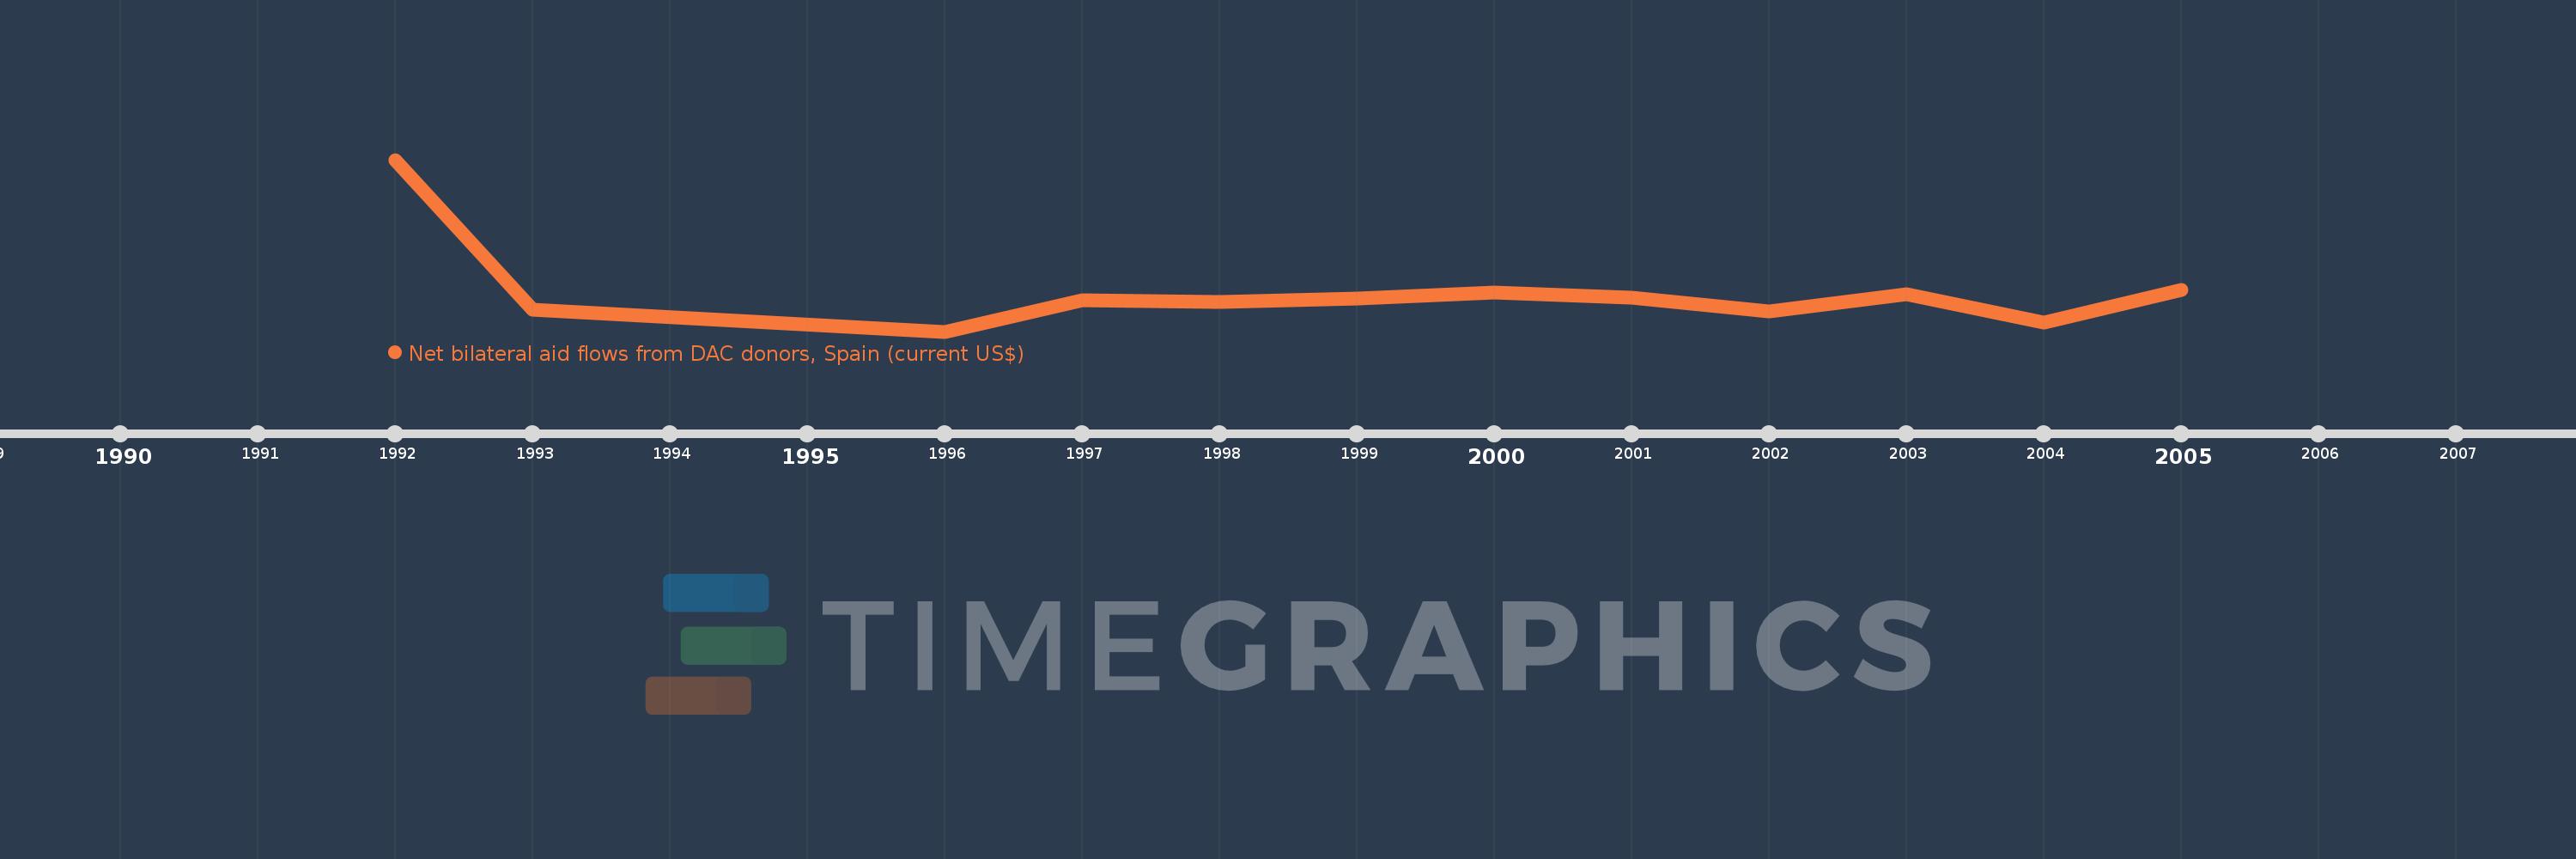
This timeline shows a graph from 1992 to 2005 of Poland. No data until 1991. Number of actual observations by date: 12.
Source name:
World Development Indicators
Source organization:
Development Assistance Committee of the Organisation for Economic Co-operation and Development, Geographical Distribution of Financial Flows to Developing Countries, Development Co-operation Report, and International Development Statistics database. Data are available online at: www.oecd.org/dac/stats/idsonline.
Categories, topics:
Aid Effectiveness
Last updated:
apr 23, 2017
Indicators value changes by year
Meaning:
1.719 mln
Minimum:
-4.32 mln
jan 1, 1996
Maximum:
22.29 mln
jan 1, 1992
At the date of observation
Value
Absolute change
Change from the previous value
jan 1, 1992
22.29 mln
+22.29 mln
0.0%
jan 1, 1993
-980.0K
-23.27 mln
-104.4%
jan 1, 1996
-4.32 mln
-3.34 mln
340.82%
jan 1, 1997
500.0K
+4.82 mln
-111.57%
jan 1, 1998
260.0K
-240.0K
-48.0%
jan 1, 1999
840.0K
+580.0K
223.08%
jan 1, 2000
1.72 mln
+880.0K
104.76%
jan 1, 2001
920.0K
-800.0K
-46.51%
jan 1, 2002
-1.16 mln
-2.08 mln
-226.09%
jan 1, 2003
1.41 mln
+2.57 mln
-221.55%
jan 1, 2004
-2.96 mln
-4.37 mln
-309.93%
jan 1, 2005
2.11 mln
+5.07 mln
-171.28%
Ranking of countries by current statistics by years