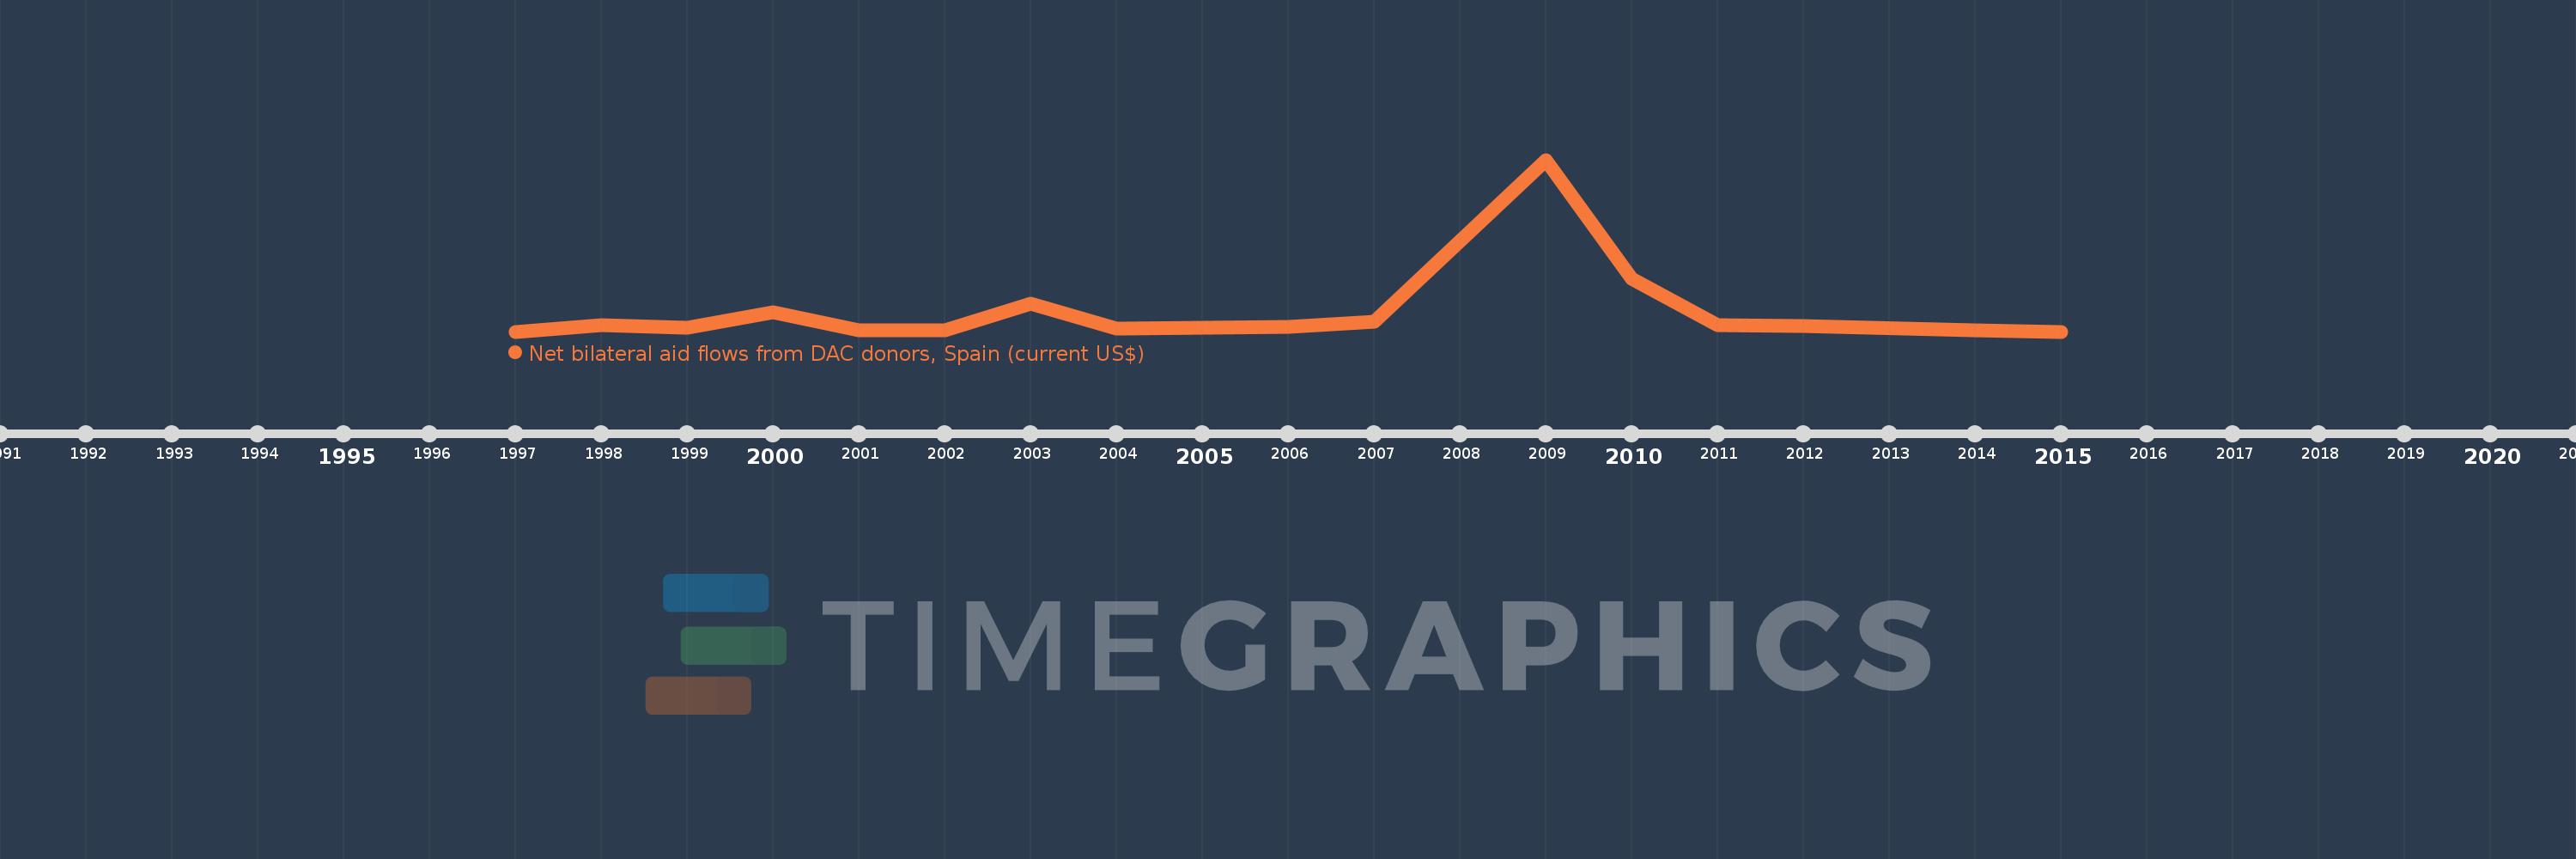
This timeline shows a graph from 1997 to 2015 of Georgia. No data until 1996. Number of actual observations by date: 17.
Source name:
World Development Indicators
Source organization:
Development Assistance Committee of the Organisation for Economic Co-operation and Development, Geographical Distribution of Financial Flows to Developing Countries, Development Co-operation Report, and International Development Statistics database. Data are available online at: www.oecd.org/dac/stats/idsonline.
Categories, topics:
Aid Effectiveness
Last updated:
apr 23, 2017
Indicators value changes by year
Meaning:
320.588K
Minimum:
30.0K
jan 1, 1997
Maximum:
2.69 mln
jan 1, 2009
At the date of observation
Value
Absolute change
Change from the previous value
jan 1, 1997
30.0K
+30.0K
0.0%
jan 1, 1998
130.0K
+100.0K
333.33%
jan 1, 1999
90.0K
-40.0K
-30.77%
jan 1, 2000
330.0K
+240.0K
266.67%
jan 1, 2001
50.0K
-280.0K
-84.85%
jan 1, 2002
50.0K
0.0
0.0%
jan 1, 2003
460.0K
+410.0K
820.0%
jan 1, 2004
80.0K
-380.0K
-82.61%
jan 1, 2005
90.0K
+10.0K
12.5%
jan 1, 2006
100.0K
+10.0K
11.11%
jan 1, 2007
180.0K
+80.0K
80.0%
jan 1, 2009
2.69 mln
+2.51 mln
1.39K%
jan 1, 2010
850.0K
-1.84 mln
-68.4%
jan 1, 2011
130.0K
-720.0K
-84.71%
jan 1, 2012
110.0K
-20.0K
-15.38%
jan 1, 2014
50.0K
-60.0K
-54.55%
jan 1, 2015
30.0K
-20.0K
-40.0%
Ranking of countries by current statistics by years