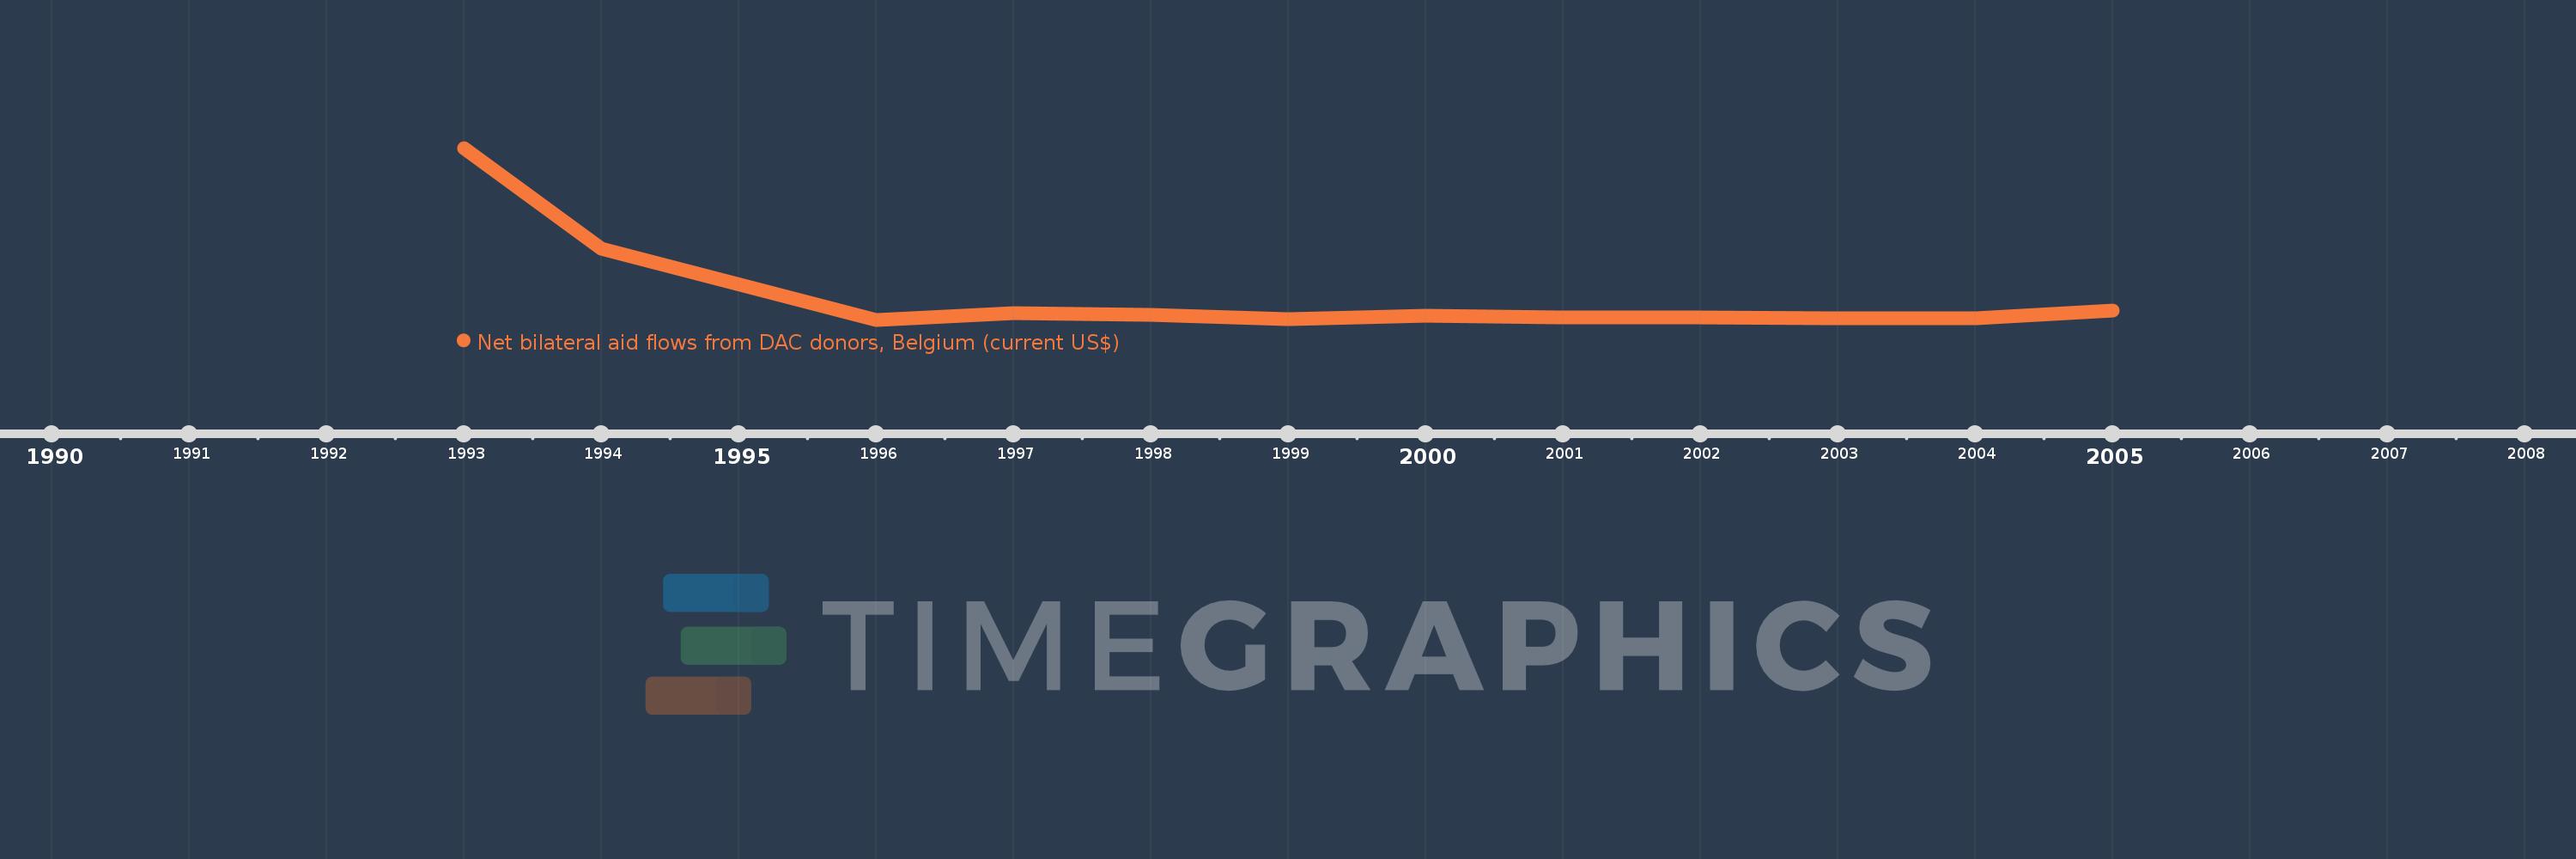
This timeline shows a graph from 1993 to 2005 of Bulgaria. No data until 1992. Number of actual observations by date: 12.
Source name:
World Development Indicators
Source organization:
Development Assistance Committee of the Organisation for Economic Co-operation and Development, Geographical Distribution of Financial Flows to Developing Countries, Development Co-operation Report, and International Development Statistics database. Data are available online at: www.oecd.org/dac/stats/idsonline.
Categories, topics:
Aid Effectiveness
Last updated:
apr 23, 2017
Indicators value changes by year
Meaning:
2.399 mln
Minimum:
70.0K
jan 1, 1996
Maximum:
17.5 mln
jan 1, 1993
At the date of observation
Value
Absolute change
Change from the previous value
jan 1, 1993
17.5 mln
+17.5 mln
0.0%
jan 1, 1994
7.3 mln
-10.2 mln
-58.29%
jan 1, 1996
70.0K
-7.23 mln
-99.04%
jan 1, 1997
780.0K
+710.0K
1.01K%
jan 1, 1998
590.0K
-190.0K
-24.36%
jan 1, 1999
130.0K
-460.0K
-77.97%
jan 1, 2000
480.0K
+350.0K
269.23%
jan 1, 2001
290.0K
-190.0K
-39.58%
jan 1, 2002
290.0K
0.0
0.0%
jan 1, 2003
200.0K
-90.0K
-31.03%
jan 1, 2004
200.0K
0.0
0.0%
jan 1, 2005
960.0K
+760.0K
380.0%
Ranking of countries by current statistics by years