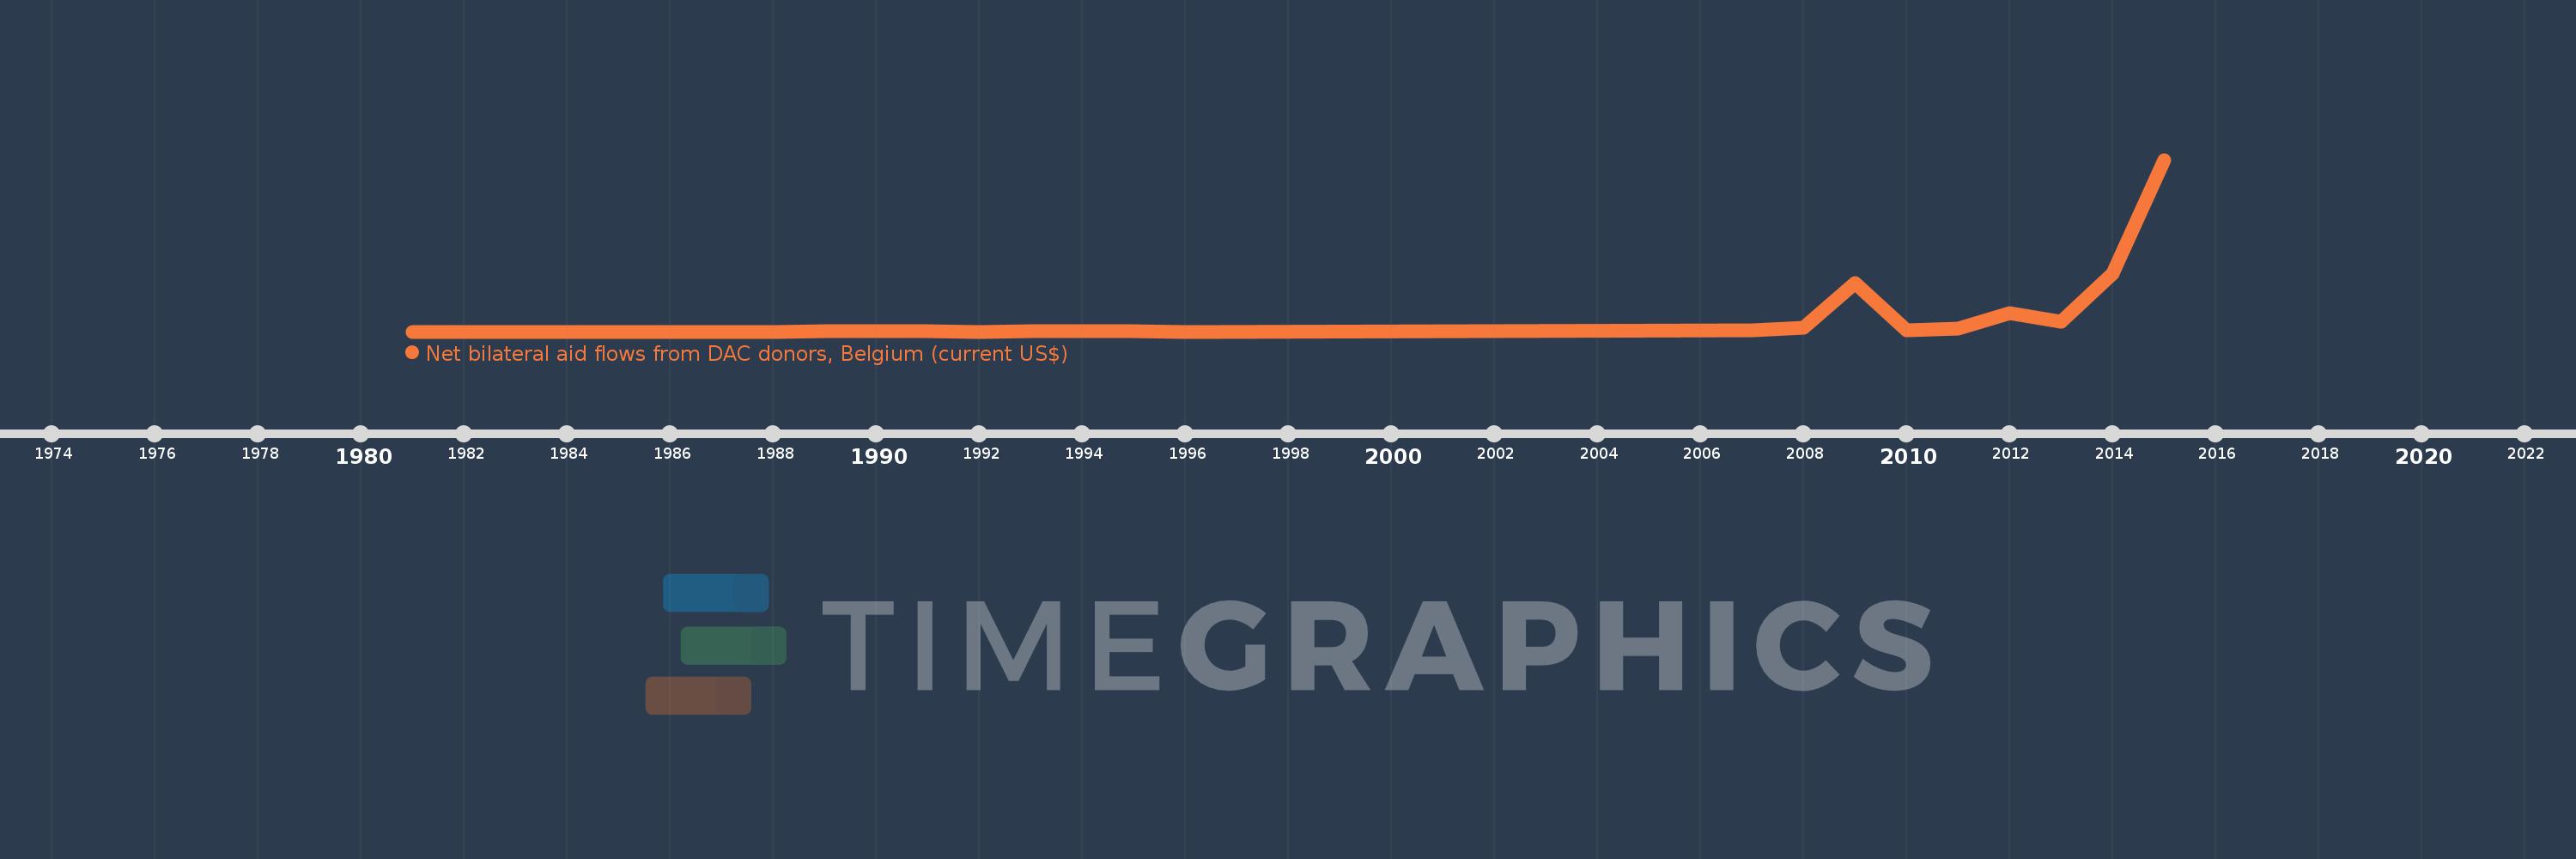
This timeline shows a graph from 1981 to 2015 of Myanmar. No data until 1980. Number of actual observations by date: 20.
Source name:
World Development Indicators
Source organization:
Development Assistance Committee of the Organisation for Economic Co-operation and Development, Geographical Distribution of Financial Flows to Developing Countries, Development Co-operation Report, and International Development Statistics database. Data are available online at: www.oecd.org/dac/stats/idsonline.
Categories, topics:
Aid Effectiveness
Last updated:
apr 23, 2017
Indicators value changes by year
Meaning:
725.0K
Minimum:
10.0K
jan 1, 1981
Maximum:
7.74 mln
jan 1, 2015
At the date of observation
Value
Absolute change
Change from the previous value
jan 1, 1981
10.0K
+10.0K
0.0%
jan 1, 1984
10.0K
0.0
0.0%
jan 1, 1988
10.0K
0.0
0.0%
jan 1, 1989
20.0K
+10.0K
100.0%
jan 1, 1990
20.0K
0.0
0.0%
jan 1, 1991
20.0K
0.0
0.0%
jan 1, 1992
10.0K
-10.0K
-50.0%
jan 1, 1993
30.0K
+20.0K
200.0%
jan 1, 1994
20.0K
-10.0K
-33.33%
jan 1, 1995
20.0K
0.0
0.0%
jan 1, 1996
10.0K
-10.0K
-50.0%
jan 1, 2007
80.0K
+70.0K
700.0%
jan 1, 2008
200.0K
+120.0K
150.0%
jan 1, 2009
2.2 mln
+2.0 mln
1000.0%
jan 1, 2010
60.0K
-2.14 mln
-97.27%
jan 1, 2011
140.0K
+80.0K
133.33%
jan 1, 2012
840.0K
+700.0K
500.0%
jan 1, 2013
440.0K
-400.0K
-47.62%
jan 1, 2014
2.62 mln
+2.18 mln
495.45%
jan 1, 2015
7.74 mln
+5.12 mln
195.42%
Ranking of countries by current statistics by years