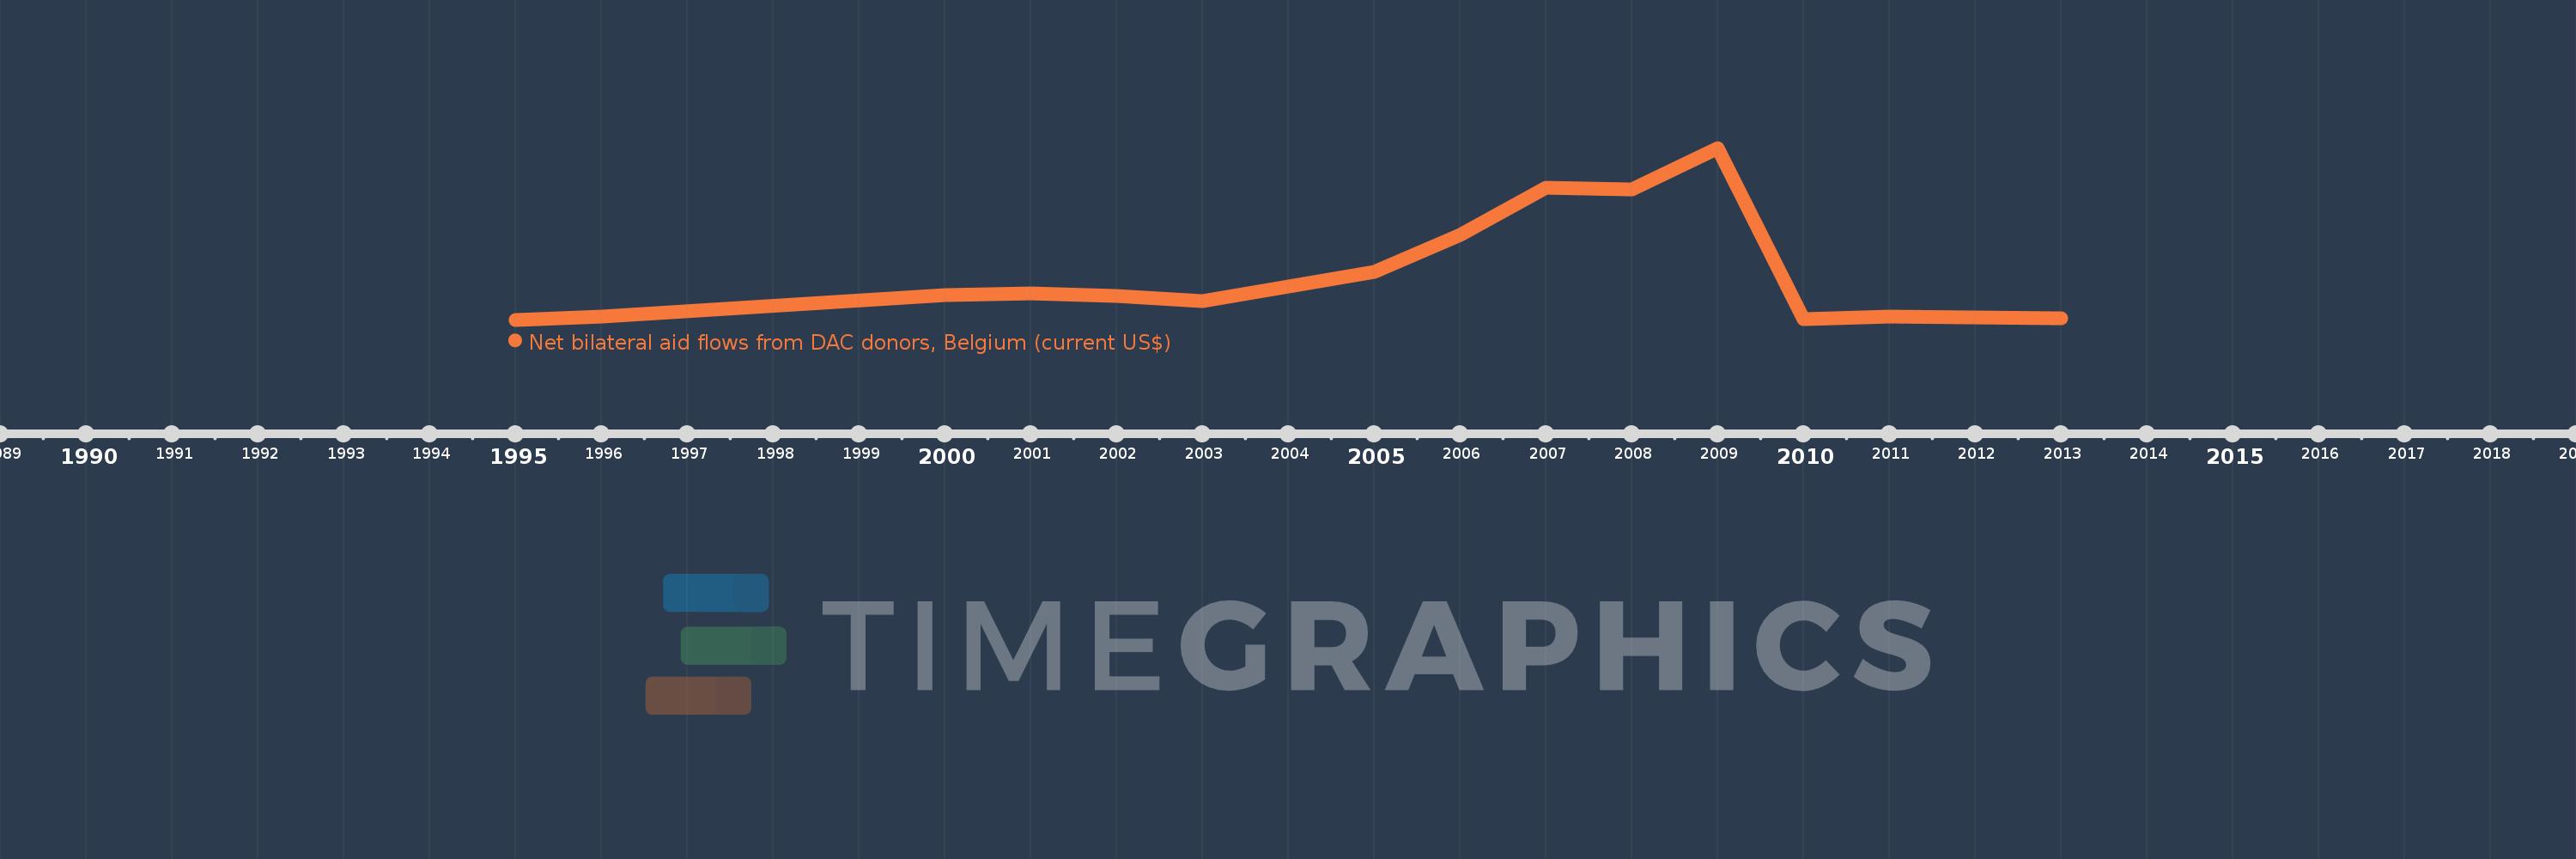
This timeline shows a graph from 1995 to 2013 of Georgia. No data until 1994. Number of actual observations by date: 15.
Source name:
World Development Indicators
Source organization:
Development Assistance Committee of the Organisation for Economic Co-operation and Development, Geographical Distribution of Financial Flows to Developing Countries, Development Co-operation Report, and International Development Statistics database. Data are available online at: www.oecd.org/dac/stats/idsonline.
Categories, topics:
Aid Effectiveness
Last updated:
apr 23, 2017
Indicators value changes by year
Meaning:
548.667K
Minimum:
10.0K
jan 1, 1995
Maximum:
1.99 mln
jan 1, 2009
At the date of observation
Value
Absolute change
Change from the previous value
jan 1, 1995
10.0K
+10.0K
0.0%
jan 1, 1996
50.0K
+40.0K
400.0%
jan 1, 2000
290.0K
+240.0K
480.0%
jan 1, 2001
310.0K
+20.0K
6.9%
jan 1, 2002
280.0K
-30.0K
-9.68%
jan 1, 2003
220.0K
-60.0K
-21.43%
jan 1, 2004
390.0K
+170.0K
77.27%
jan 1, 2005
560.0K
+170.0K
43.59%
jan 1, 2006
990.0K
+430.0K
76.79%
jan 1, 2007
1.53 mln
+540.0K
54.55%
jan 1, 2008
1.51 mln
-20.0K
-1.31%
jan 1, 2009
1.99 mln
+480.0K
31.79%
jan 1, 2010
20.0K
-1.97 mln
-98.99%
jan 1, 2011
50.0K
+30.0K
150.0%
jan 1, 2013
30.0K
-20.0K
-40.0%
Ranking of countries by current statistics by years