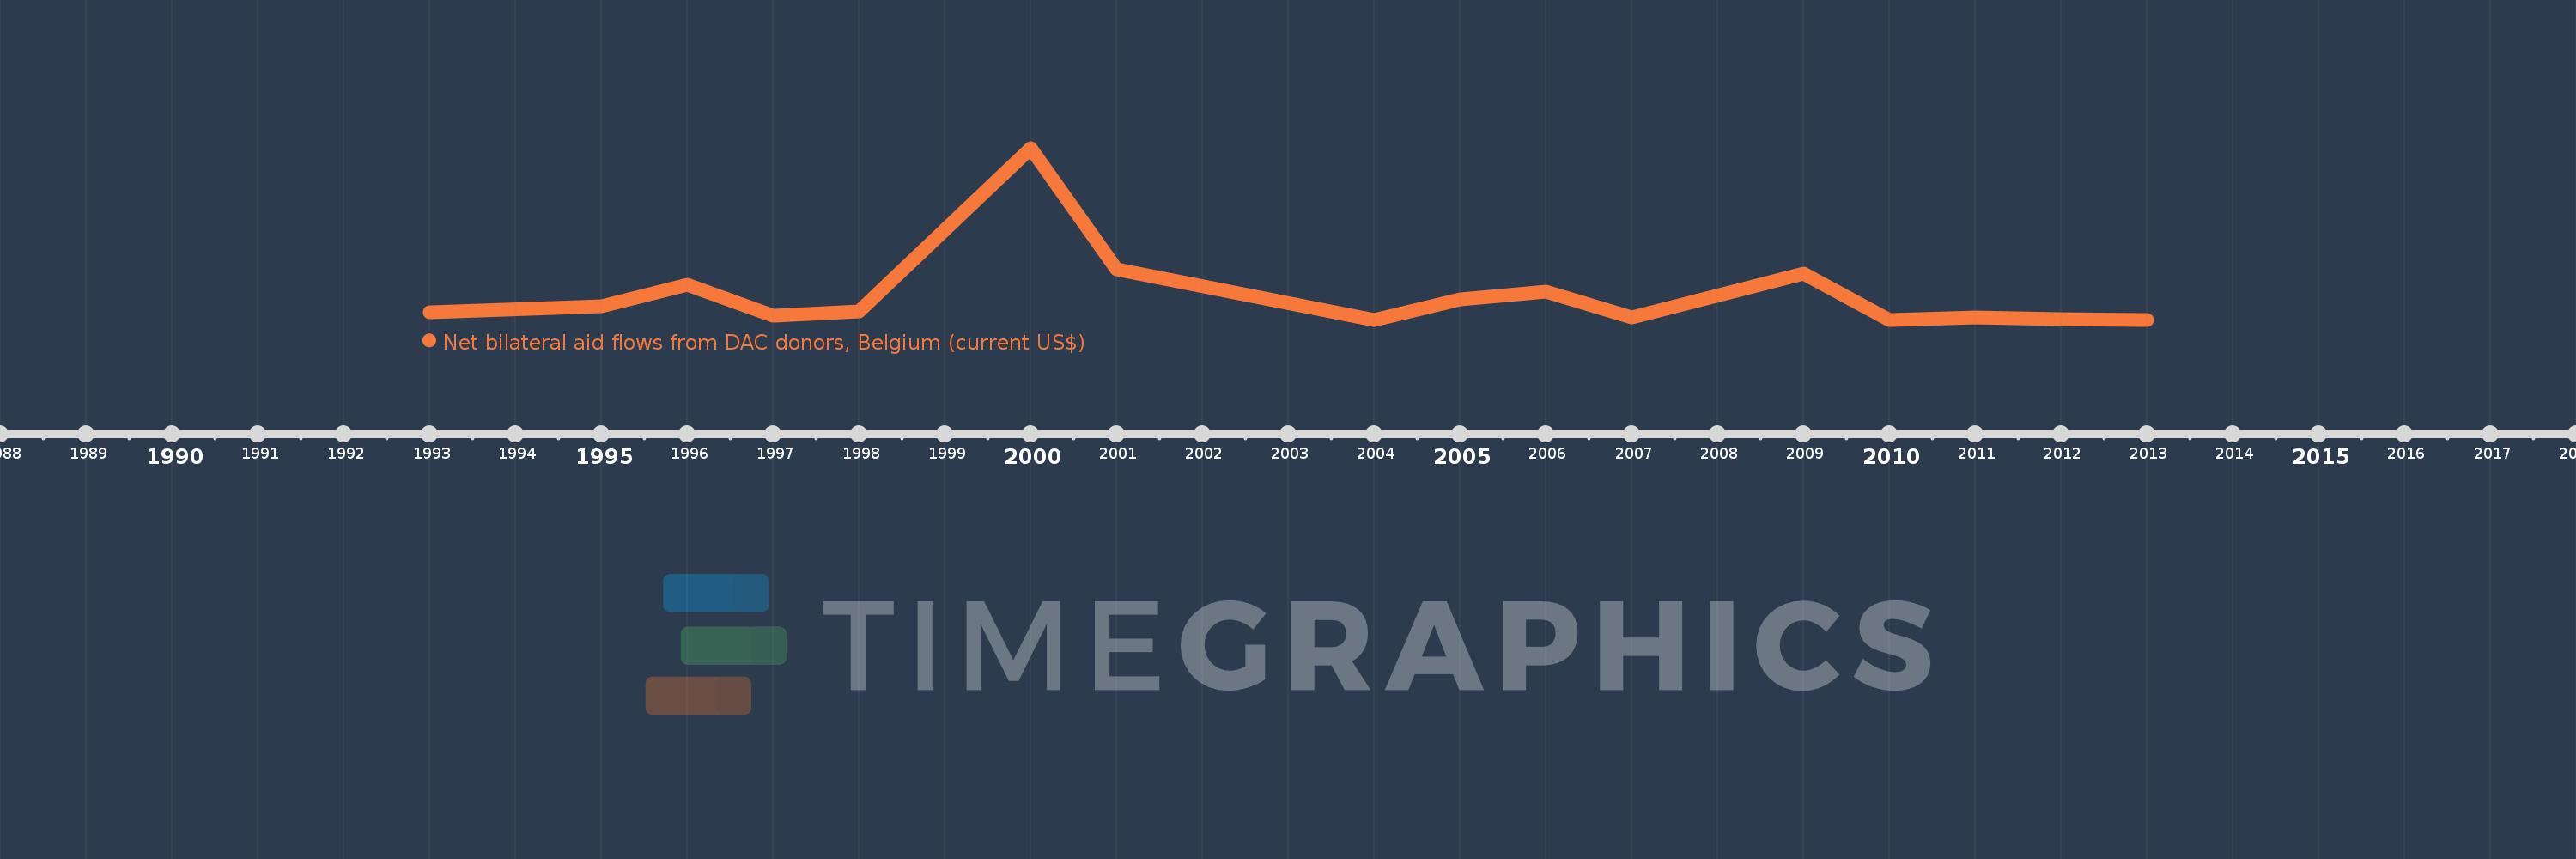
This timeline shows a graph from 1993 to 2013 of Albania. No data until 1992. Number of actual observations by date: 16.
Source name:
World Development Indicators
Source organization:
Development Assistance Committee of the Organisation for Economic Co-operation and Development, Geographical Distribution of Financial Flows to Developing Countries, Development Co-operation Report, and International Development Statistics database. Data are available online at: www.oecd.org/dac/stats/idsonline.
Categories, topics:
Aid Effectiveness
Last updated:
apr 23, 2017
Indicators value changes by year
Meaning:
438.75K
Minimum:
10.0K
jan 1, 2004
Maximum:
3.03 mln
jan 1, 2000
At the date of observation
Value
Absolute change
Change from the previous value
jan 1, 1993
140.0K
+140.0K
0.0%
jan 1, 1995
250.0K
+110.0K
78.57%
jan 1, 1996
620.0K
+370.0K
148.0%
jan 1, 1997
80.0K
-540.0K
-87.1%
jan 1, 1998
160.0K
+80.0K
100.0%
jan 1, 2000
3.03 mln
+2.87 mln
1.79K%
jan 1, 2001
890.0K
-2.14 mln
-70.63%
jan 1, 2004
10.0K
-880.0K
-98.88%
jan 1, 2005
370.0K
+360.0K
3.6K%
jan 1, 2006
510.0K
+140.0K
37.84%
jan 1, 2007
50.0K
-460.0K
-90.2%
jan 1, 2009
820.0K
+770.0K
1.54K%
jan 1, 2010
10.0K
-810.0K
-98.78%
jan 1, 2011
50.0K
+40.0K
400.0%
jan 1, 2012
20.0K
-30.0K
-60.0%
jan 1, 2013
10.0K
-10.0K
-50.0%
Ranking of countries by current statistics by years