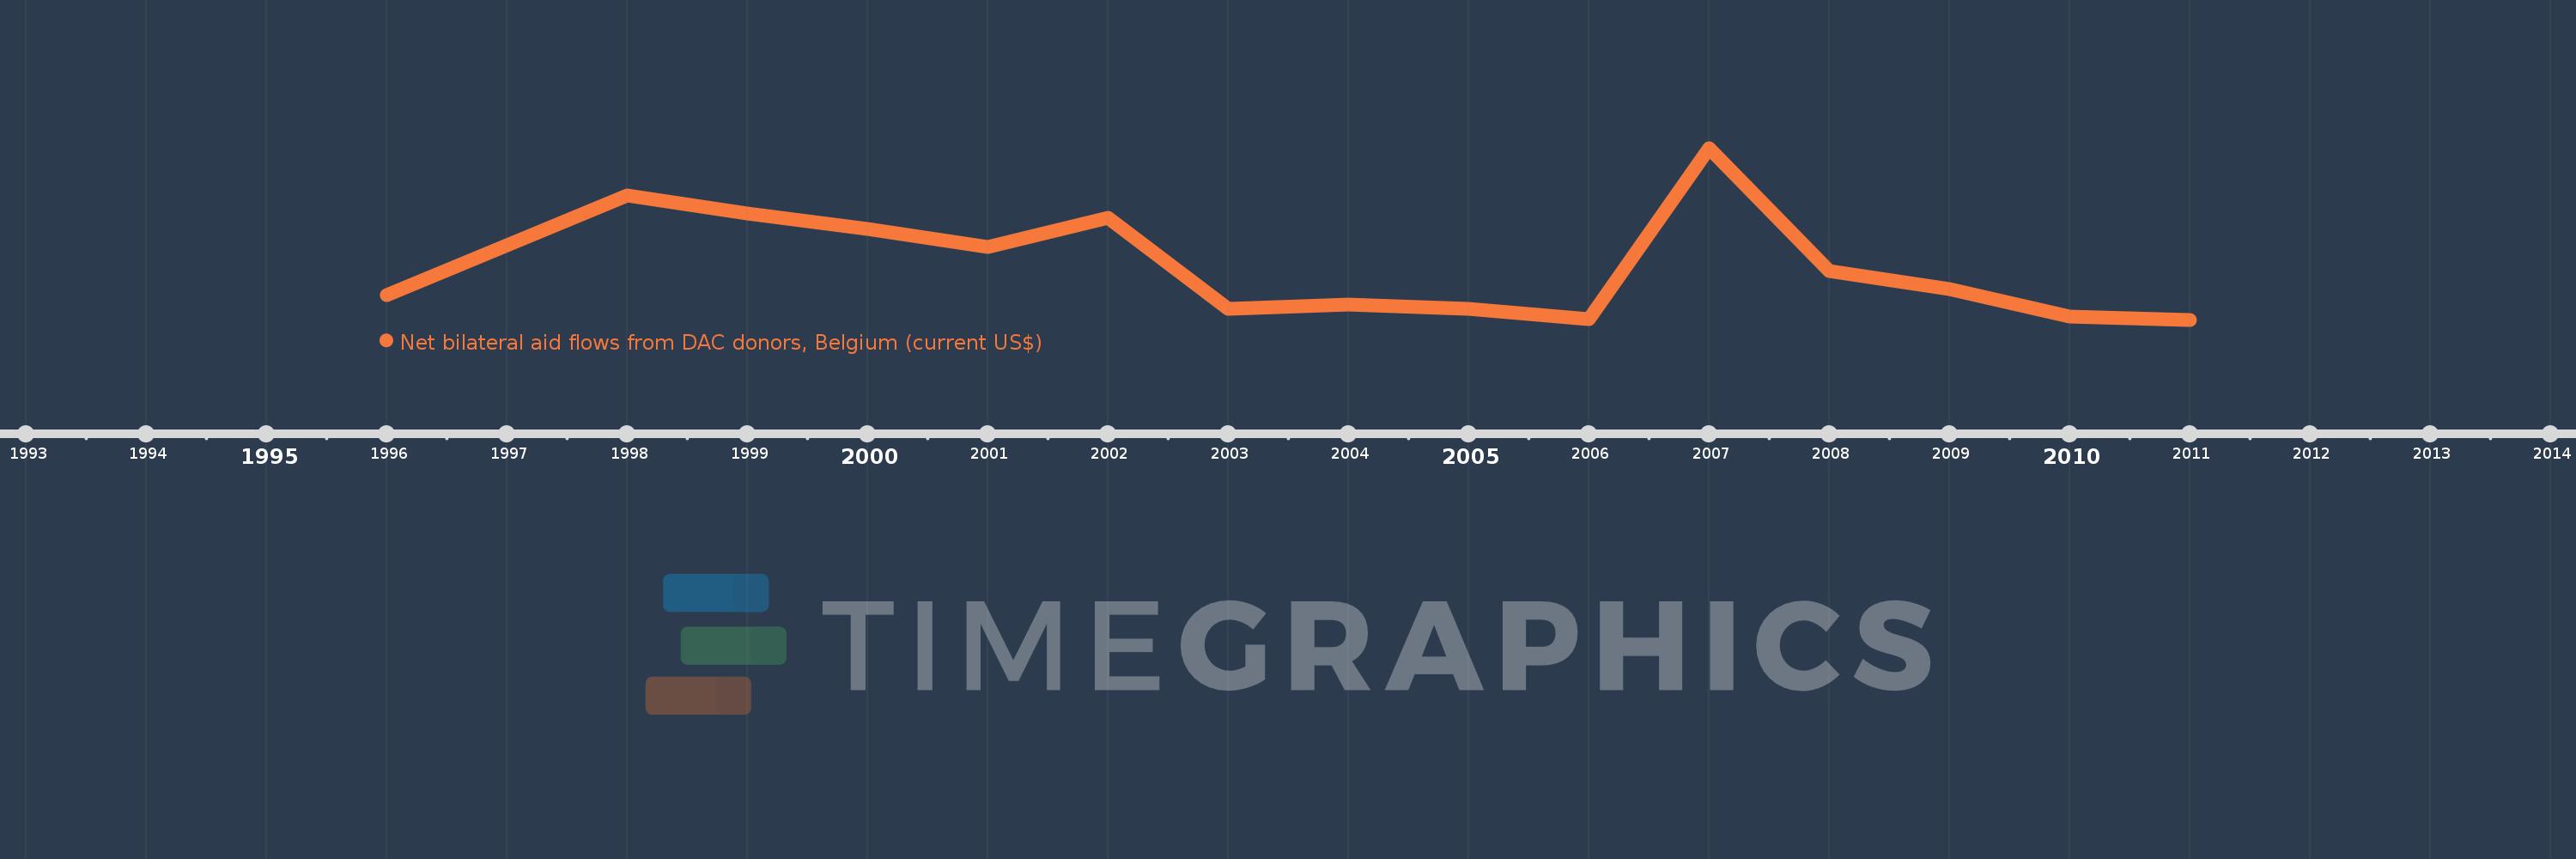
This timeline shows a graph from 1996 to 2011 of Croatia. No data until 1995. Number of actual observations by date: 15.
Source name:
World Development Indicators
Source organization:
Development Assistance Committee of the Organisation for Economic Co-operation and Development, Geographical Distribution of Financial Flows to Developing Countries, Development Co-operation Report, and International Development Statistics database. Data are available online at: www.oecd.org/dac/stats/idsonline.
Categories, topics:
Aid Effectiveness
Last updated:
apr 23, 2017
Indicators value changes by year
Meaning:
555.333K
Minimum:
10.0K
jan 1, 2011
Maximum:
1.74 mln
jan 1, 2007
At the date of observation
Value
Absolute change
Change from the previous value
jan 1, 1996
260.0K
+260.0K
0.0%
jan 1, 1998
1.26 mln
+1000.0K
384.62%
jan 1, 1999
1.08 mln
-180.0K
-14.29%
jan 1, 2000
920.0K
-160.0K
-14.81%
jan 1, 2001
740.0K
-180.0K
-19.57%
jan 1, 2002
1.04 mln
+300.0K
40.54%
jan 1, 2003
120.0K
-920.0K
-88.46%
jan 1, 2004
160.0K
+40.0K
33.33%
jan 1, 2005
120.0K
-40.0K
-25.0%
jan 1, 2006
20.0K
-100.0K
-83.33%
jan 1, 2007
1.74 mln
+1.72 mln
8.6K%
jan 1, 2008
500.0K
-1.24 mln
-71.26%
jan 1, 2009
320.0K
-180.0K
-36.0%
jan 1, 2010
40.0K
-280.0K
-87.5%
jan 1, 2011
10.0K
-30.0K
-75.0%
Ranking of countries by current statistics by years