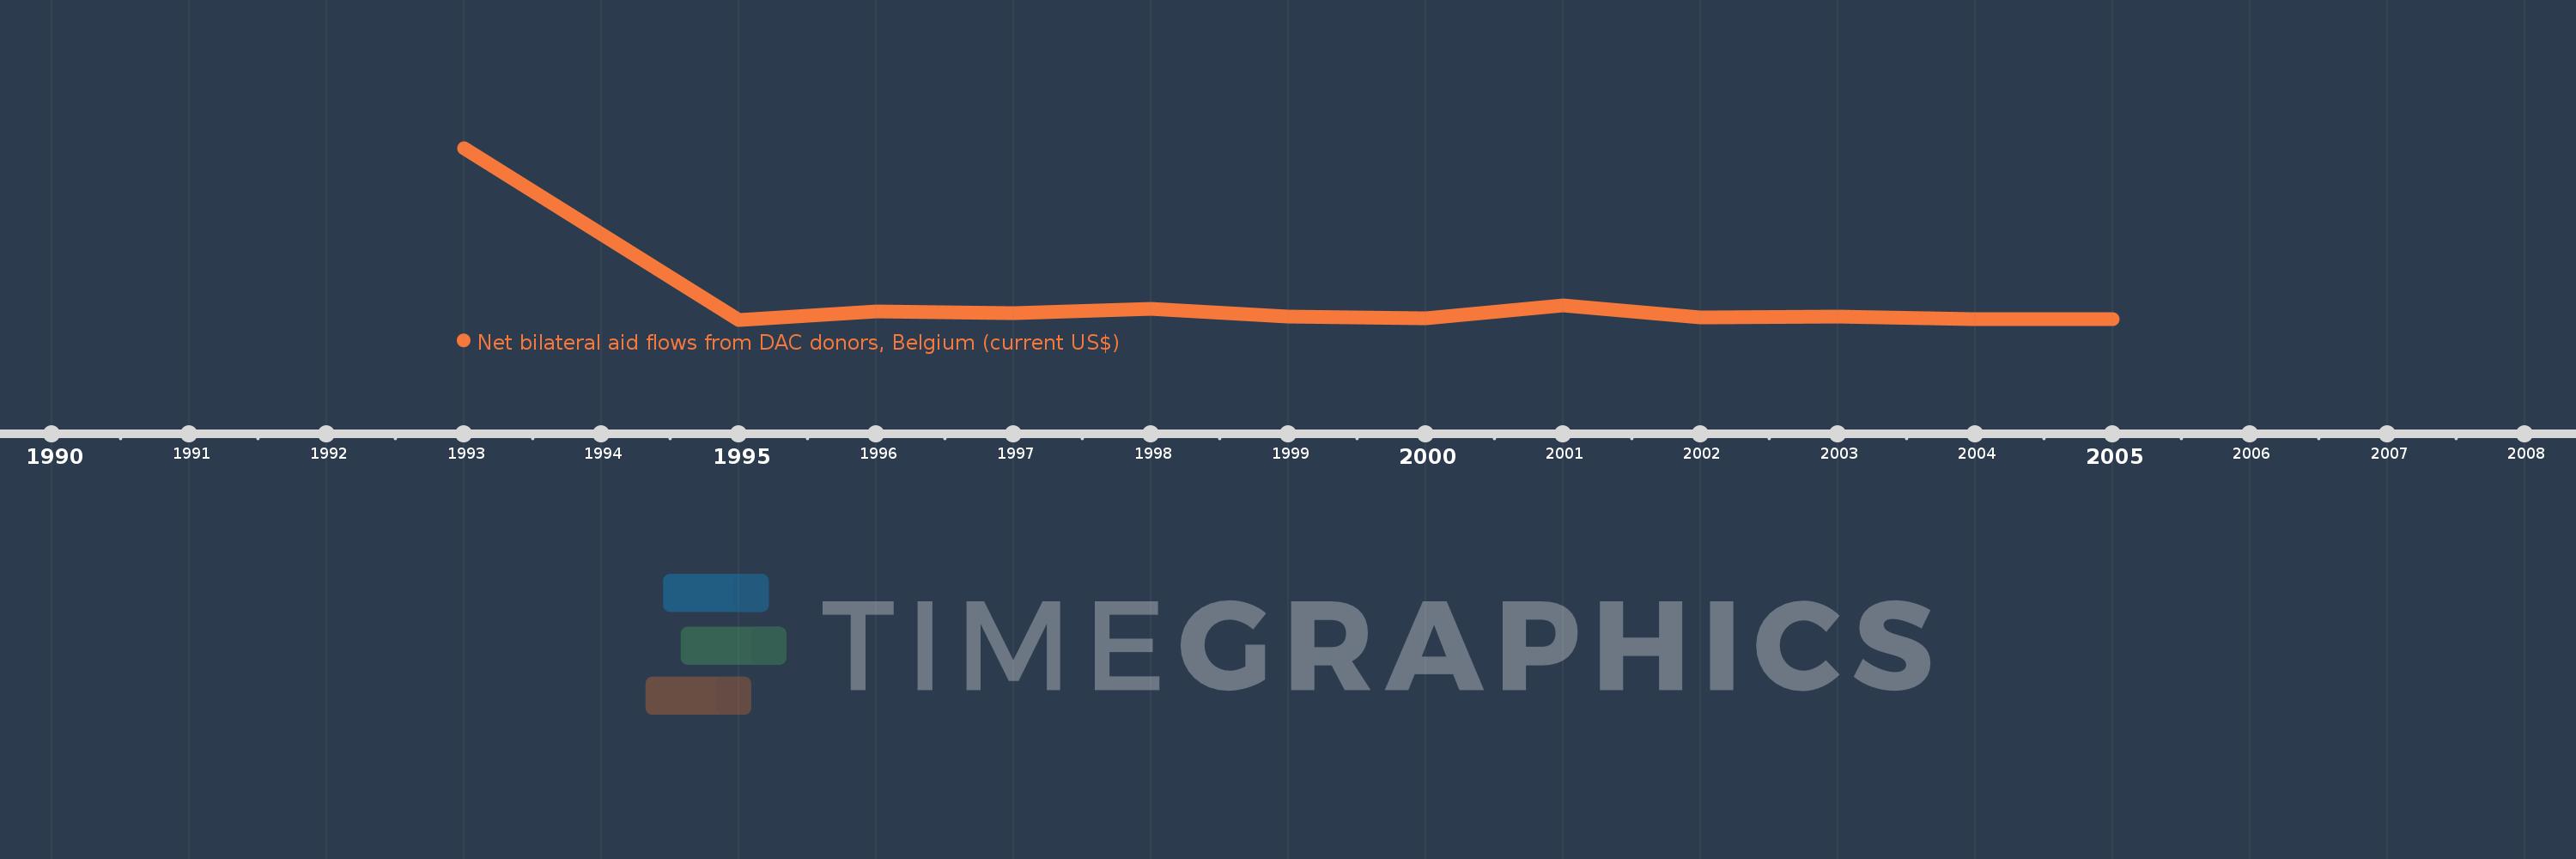
This timeline shows a graph from 1993 to 2005 of Russian Federation. No data until 1992. Number of actual observations by date: 12.
Source name:
World Development Indicators
Source organization:
Development Assistance Committee of the Organisation for Economic Co-operation and Development, Geographical Distribution of Financial Flows to Developing Countries, Development Co-operation Report, and International Development Statistics database. Data are available online at: www.oecd.org/dac/stats/idsonline.
Categories, topics:
Aid Effectiveness
Last updated:
apr 23, 2017
Indicators value changes by year
Meaning:
1.933 mln
Minimum:
20.0K
jan 1, 1995
Maximum:
17.7 mln
jan 1, 1993
At the date of observation
Value
Absolute change
Change from the previous value
jan 1, 1993
17.7 mln
+17.7 mln
0.0%
jan 1, 1995
20.0K
-17.68 mln
-99.89%
jan 1, 1996
860.0K
+840.0K
4.2K%
jan 1, 1997
670.0K
-190.0K
-22.09%
jan 1, 1998
1.14 mln
+470.0K
70.15%
jan 1, 1999
380.0K
-760.0K
-66.67%
jan 1, 2000
170.0K
-210.0K
-55.26%
jan 1, 2001
1.48 mln
+1.31 mln
770.59%
jan 1, 2002
240.0K
-1.24 mln
-83.78%
jan 1, 2003
340.0K
+100.0K
41.67%
jan 1, 2004
100.0K
-240.0K
-70.59%
jan 1, 2005
90.0K
-10.0K
-10.0%
Ranking of countries by current statistics by years