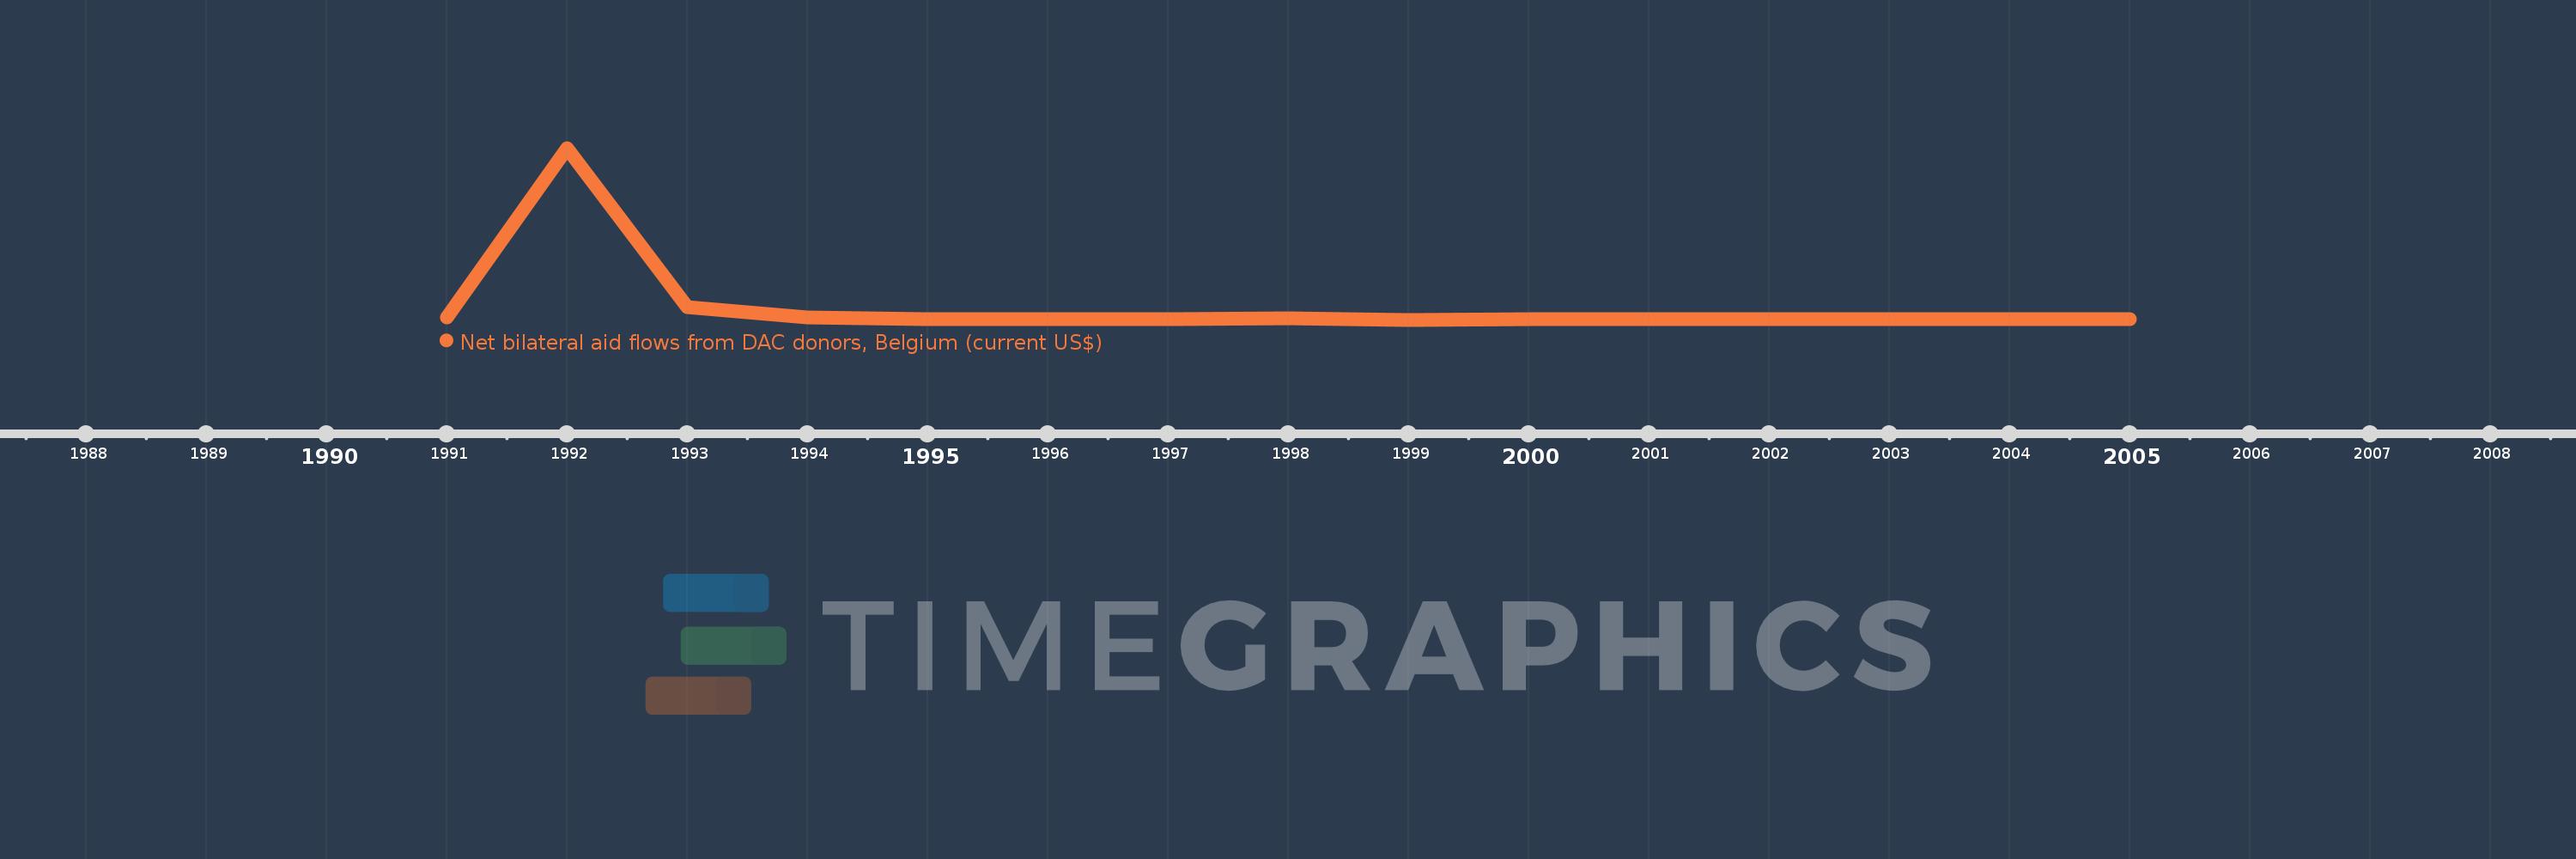
This timeline shows a graph from 1991 to 2005 of Poland. No data until 1990. Number of actual observations by date: 15.
Source name:
World Development Indicators
Source organization:
Development Assistance Committee of the Organisation for Economic Co-operation and Development, Geographical Distribution of Financial Flows to Developing Countries, Development Co-operation Report, and International Development Statistics database. Data are available online at: www.oecd.org/dac/stats/idsonline.
Categories, topics:
Aid Effectiveness
Last updated:
apr 23, 2017
Indicators value changes by year
Meaning:
12.031 mln
Minimum:
40.0K
jan 1, 1999
Maximum:
157.9 mln
jan 1, 1992
At the date of observation
Value
Absolute change
Change from the previous value
jan 1, 1991
2.37 mln
+2.37 mln
0.0%
jan 1, 1992
157.9 mln
+155.53 mln
6.56K%
jan 1, 1993
11.9 mln
-146.0 mln
-92.46%
jan 1, 1994
2.3 mln
-9.6 mln
-80.67%
jan 1, 1995
310.0K
-1.99 mln
-86.52%
jan 1, 1996
430.0K
+120.0K
38.71%
jan 1, 1997
670.0K
+240.0K
55.81%
jan 1, 1998
1.35 mln
+680.0K
101.49%
jan 1, 1999
40.0K
-1.31 mln
-97.04%
jan 1, 2000
400.0K
+360.0K
900.0%
jan 1, 2001
390.0K
-10.0K
-2.5%
jan 1, 2002
370.0K
-20.0K
-5.13%
jan 1, 2003
480.0K
+110.0K
29.73%
jan 1, 2004
840.0K
+360.0K
75.0%
jan 1, 2005
720.0K
-120.0K
-14.29%
Ranking of countries by current statistics by years