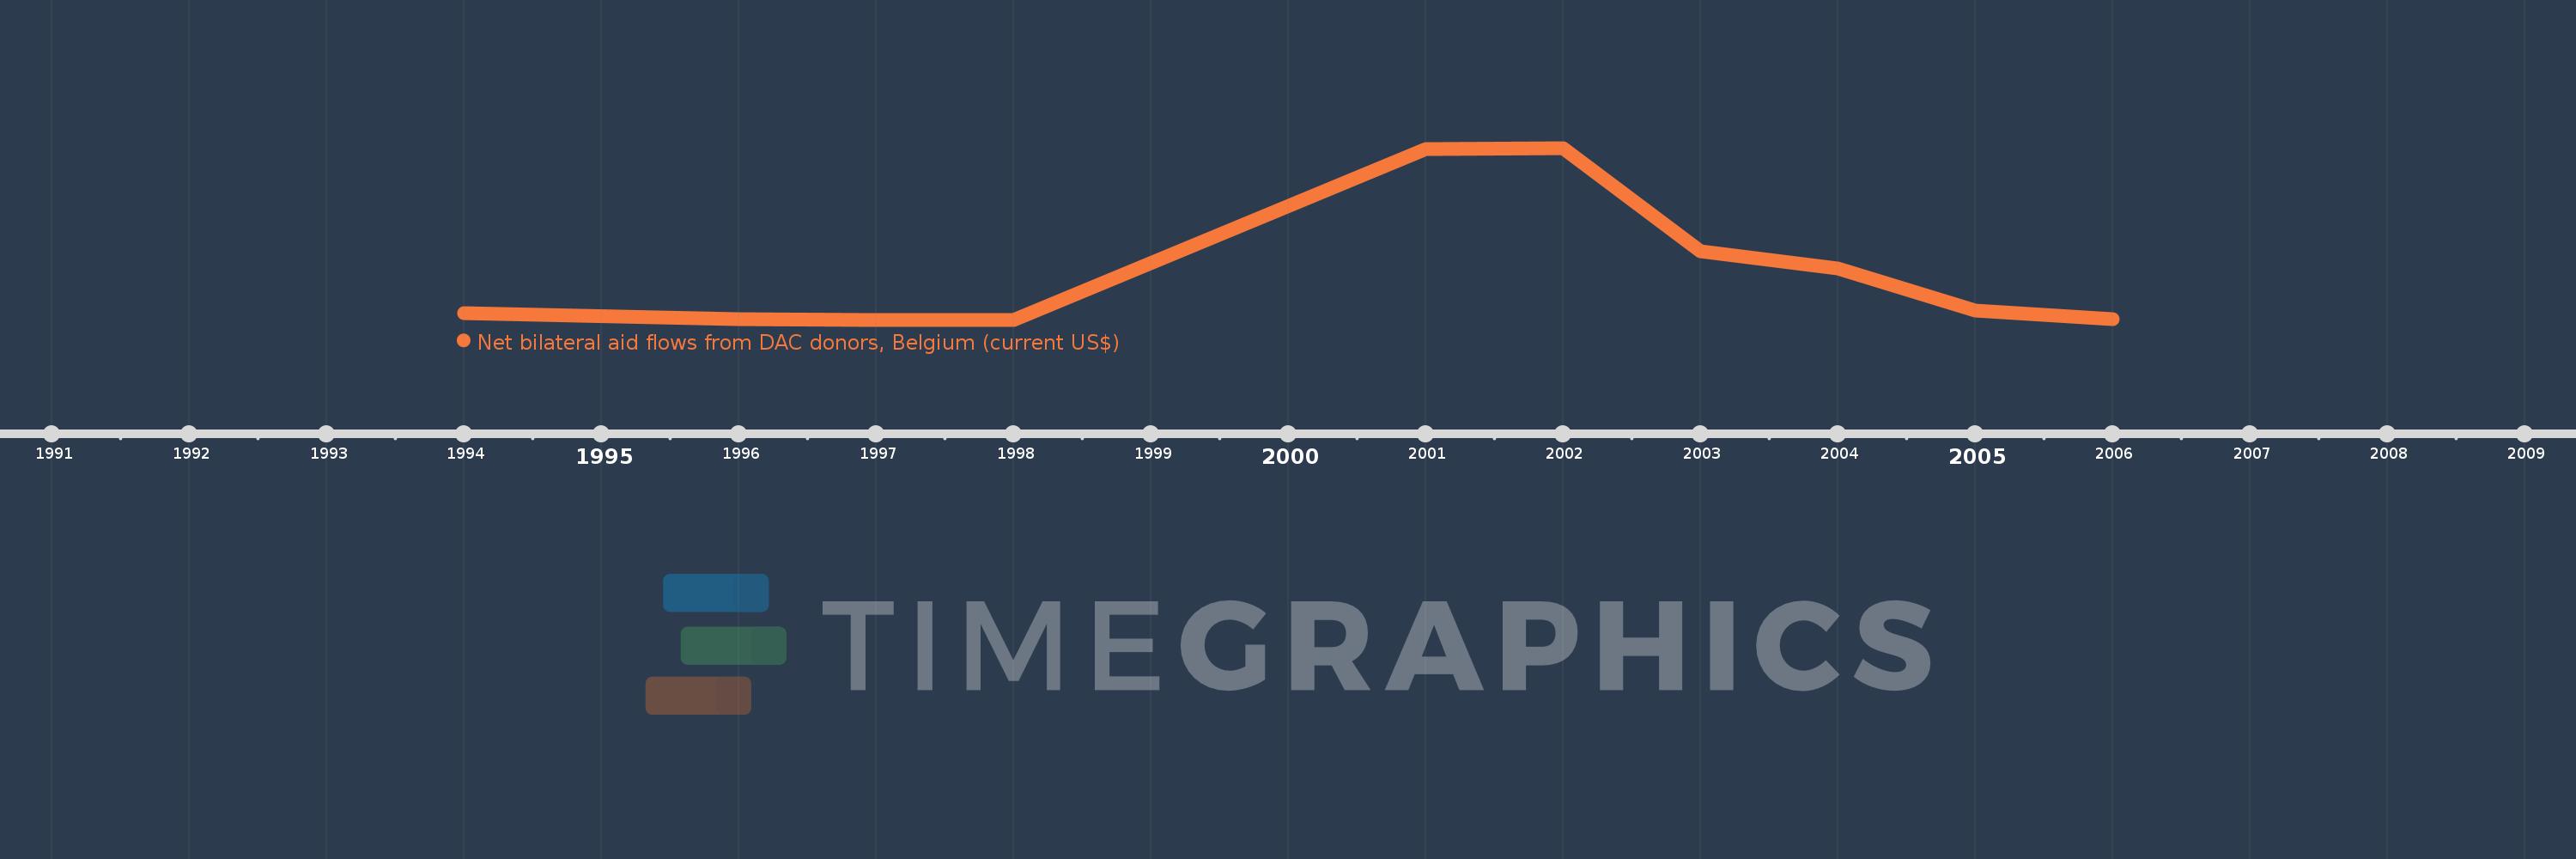
This timeline shows a graph from 1994 to 2006 of Timor-Leste. No data until 1993. Number of actual observations by date: 10.
Source name:
World Development Indicators
Source organization:
Development Assistance Committee of the Organisation for Economic Co-operation and Development, Geographical Distribution of Financial Flows to Developing Countries, Development Co-operation Report, and International Development Statistics database. Data are available online at: www.oecd.org/dac/stats/idsonline.
Categories, topics:
Aid Effectiveness
Last updated:
apr 23, 2017
Indicators value changes by year
Meaning:
2.029 mln
Minimum:
10.0K
jan 1, 1997
Maximum:
7.26 mln
jan 1, 2002
At the date of observation
Value
Absolute change
Change from the previous value
jan 1, 1994
290.0K
+290.0K
0.0%
jan 1, 1996
20.0K
-270.0K
-93.1%
jan 1, 1997
10.0K
-10.0K
-50.0%
jan 1, 1998
10.0K
0.0
0.0%
jan 1, 2001
7.22 mln
+7.21 mln
72.1K%
jan 1, 2002
7.26 mln
+40.0K
0.55%
jan 1, 2003
2.89 mln
-4.37 mln
-60.19%
jan 1, 2004
2.18 mln
-710.0K
-24.57%
jan 1, 2005
390.0K
-1.79 mln
-82.11%
jan 1, 2006
20.0K
-370.0K
-94.87%
Ranking of countries by current statistics by years