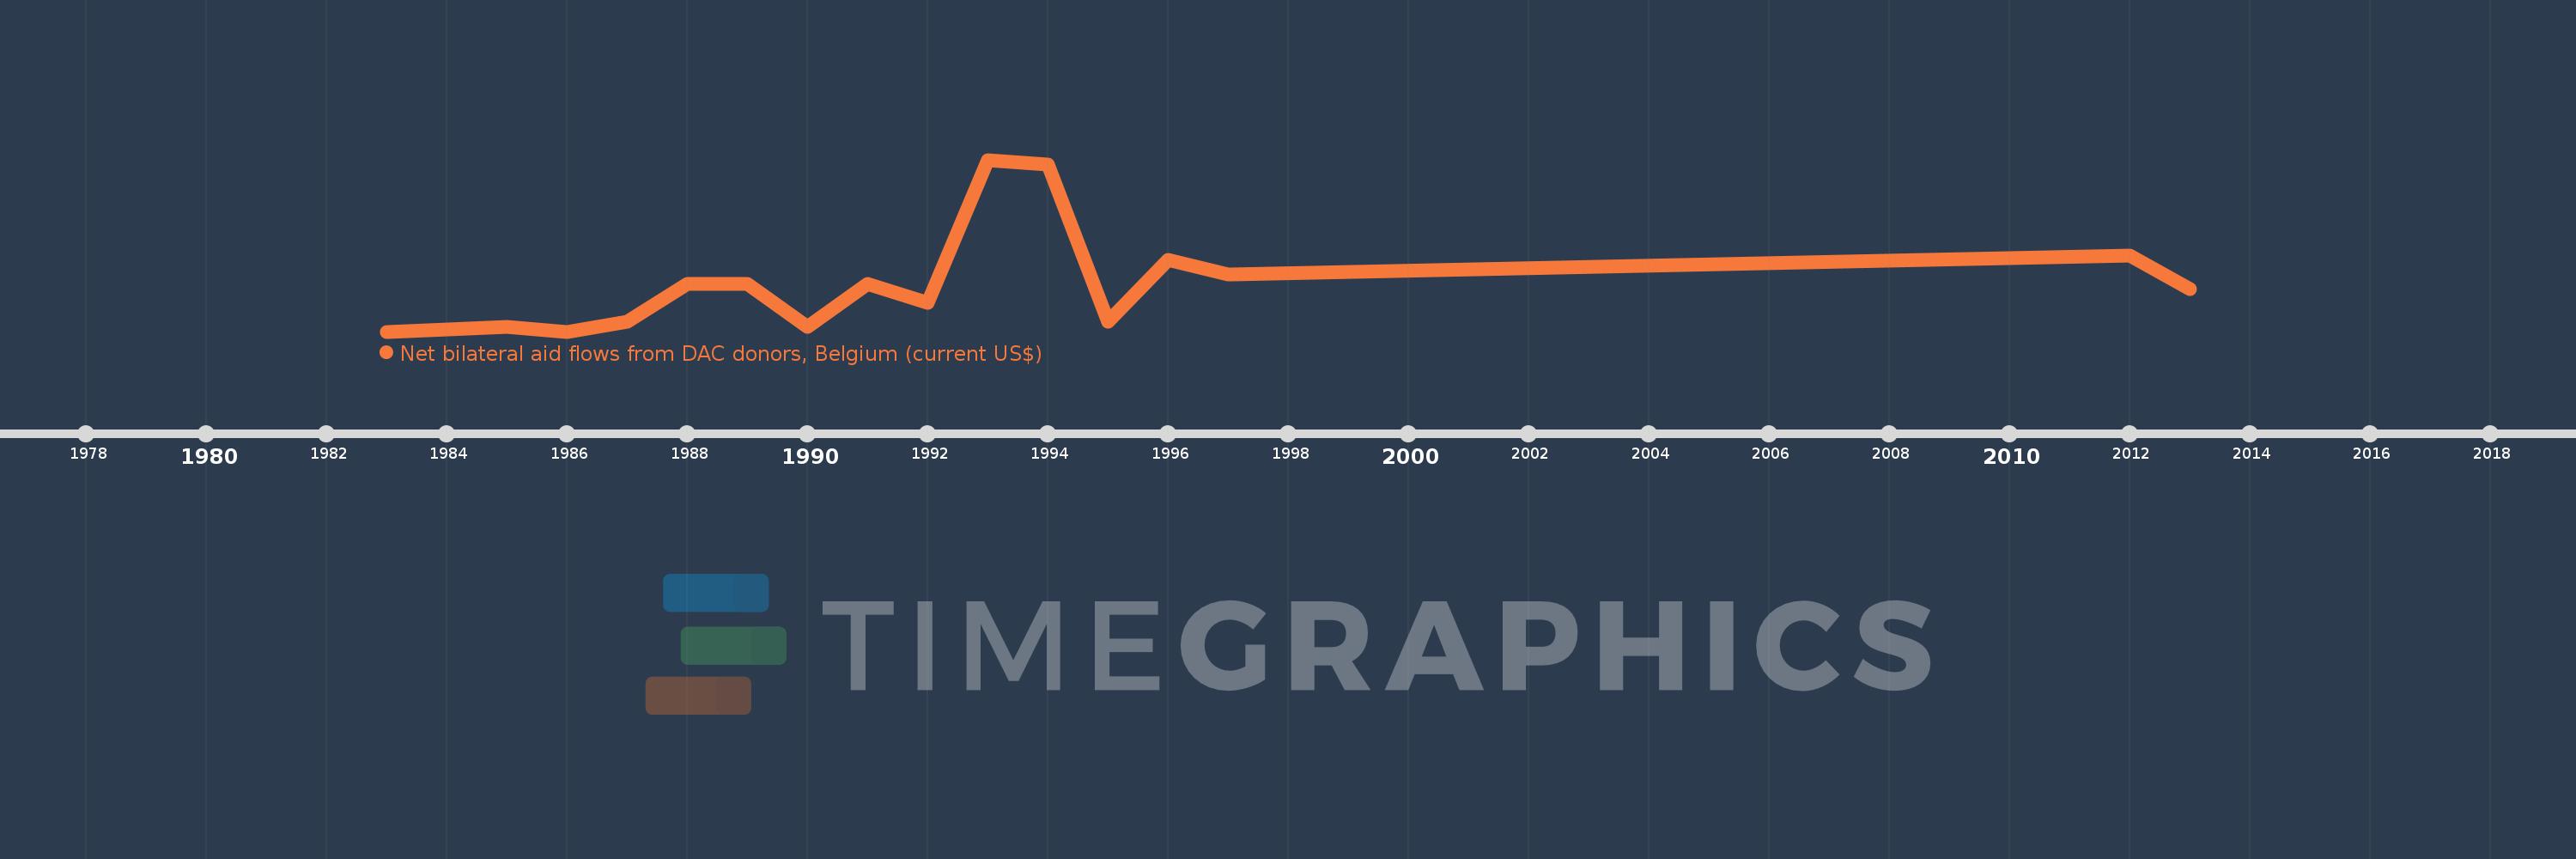
This timeline shows a graph from 1983 to 2013 of Equatorial Guinea. No data until 1982. Number of actual observations by date: 16.
Source name:
World Development Indicators
Source organization:
Development Assistance Committee of the Organisation for Economic Co-operation and Development, Geographical Distribution of Financial Flows to Developing Countries, Development Co-operation Report, and International Development Statistics database. Data are available online at: www.oecd.org/dac/stats/idsonline.
Categories, topics:
Aid Effectiveness
Last updated:
apr 23, 2017
Indicators value changes by year
Meaning:
123.125K
Minimum:
20.0K
jan 1, 1983
Maximum:
380.0K
jan 1, 1993
At the date of observation
Value
Absolute change
Change from the previous value
jan 1, 1983
20.0K
+20.0K
0.0%
jan 1, 1985
30.0K
+10.0K
50.0%
jan 1, 1986
20.0K
-10.0K
-33.33%
jan 1, 1987
40.0K
+20.0K
100.0%
jan 1, 1988
120.0K
+80.0K
200.0%
jan 1, 1989
120.0K
0.0
0.0%
jan 1, 1990
30.0K
-90.0K
-75.0%
jan 1, 1991
120.0K
+90.0K
300.0%
jan 1, 1992
80.0K
-40.0K
-33.33%
jan 1, 1993
380.0K
+300.0K
375.0%
jan 1, 1994
370.0K
-10.0K
-2.63%
jan 1, 1995
40.0K
-330.0K
-89.19%
jan 1, 1996
170.0K
+130.0K
325.0%
jan 1, 1997
140.0K
-30.0K
-17.65%
jan 1, 2012
180.0K
+40.0K
28.57%
jan 1, 2013
110.0K
-70.0K
-38.89%
Ranking of countries by current statistics by years