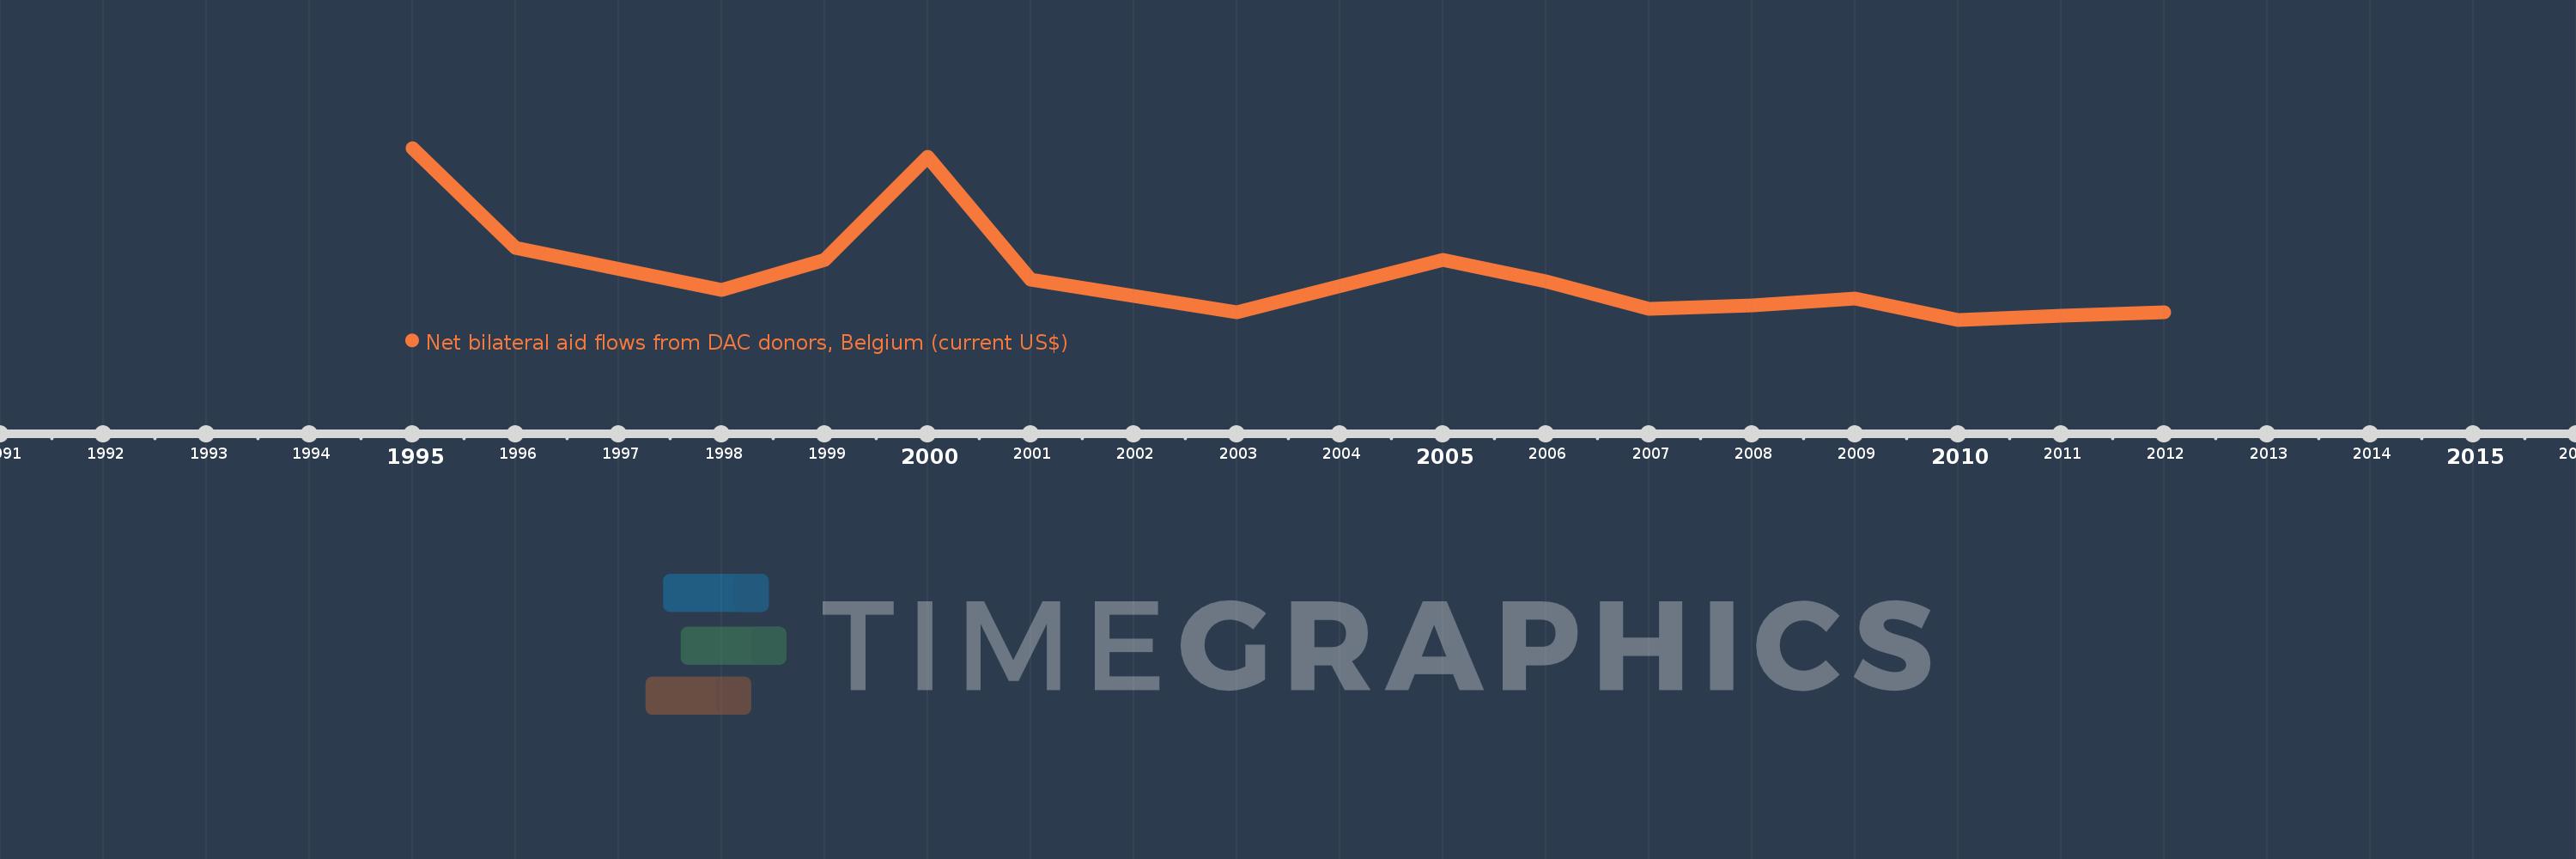
This timeline shows a graph from 1995 to 2012 of Macedonia, FYR. No data until 1994. Number of actual observations by date: 15.
Source name:
World Development Indicators
Source organization:
Development Assistance Committee of the Organisation for Economic Co-operation and Development, Geographical Distribution of Financial Flows to Developing Countries, Development Co-operation Report, and International Development Statistics database. Data are available online at: www.oecd.org/dac/stats/idsonline.
Categories, topics:
Aid Effectiveness
Last updated:
apr 23, 2017
Indicators value changes by year
Meaning:
437.333K
Minimum:
10.0K
jan 1, 2010
Maximum:
1.58 mln
jan 1, 1995
At the date of observation
Value
Absolute change
Change from the previous value
jan 1, 1995
1.58 mln
+1.58 mln
0.0%
jan 1, 1996
670.0K
-910.0K
-57.59%
jan 1, 1998
280.0K
-390.0K
-58.21%
jan 1, 1999
560.0K
+280.0K
100.0%
jan 1, 2000
1.5 mln
+940.0K
167.86%
jan 1, 2001
380.0K
-1.12 mln
-74.67%
jan 1, 2003
80.0K
-300.0K
-78.95%
jan 1, 2005
560.0K
+480.0K
600.0%
jan 1, 2006
360.0K
-200.0K
-35.71%
jan 1, 2007
110.0K
-250.0K
-69.44%
jan 1, 2008
140.0K
+30.0K
27.27%
jan 1, 2009
200.0K
+60.0K
42.86%
jan 1, 2010
10.0K
-190.0K
-95.0%
jan 1, 2011
50.0K
+40.0K
400.0%
jan 1, 2012
80.0K
+30.0K
60.0%
Ranking of countries by current statistics by years