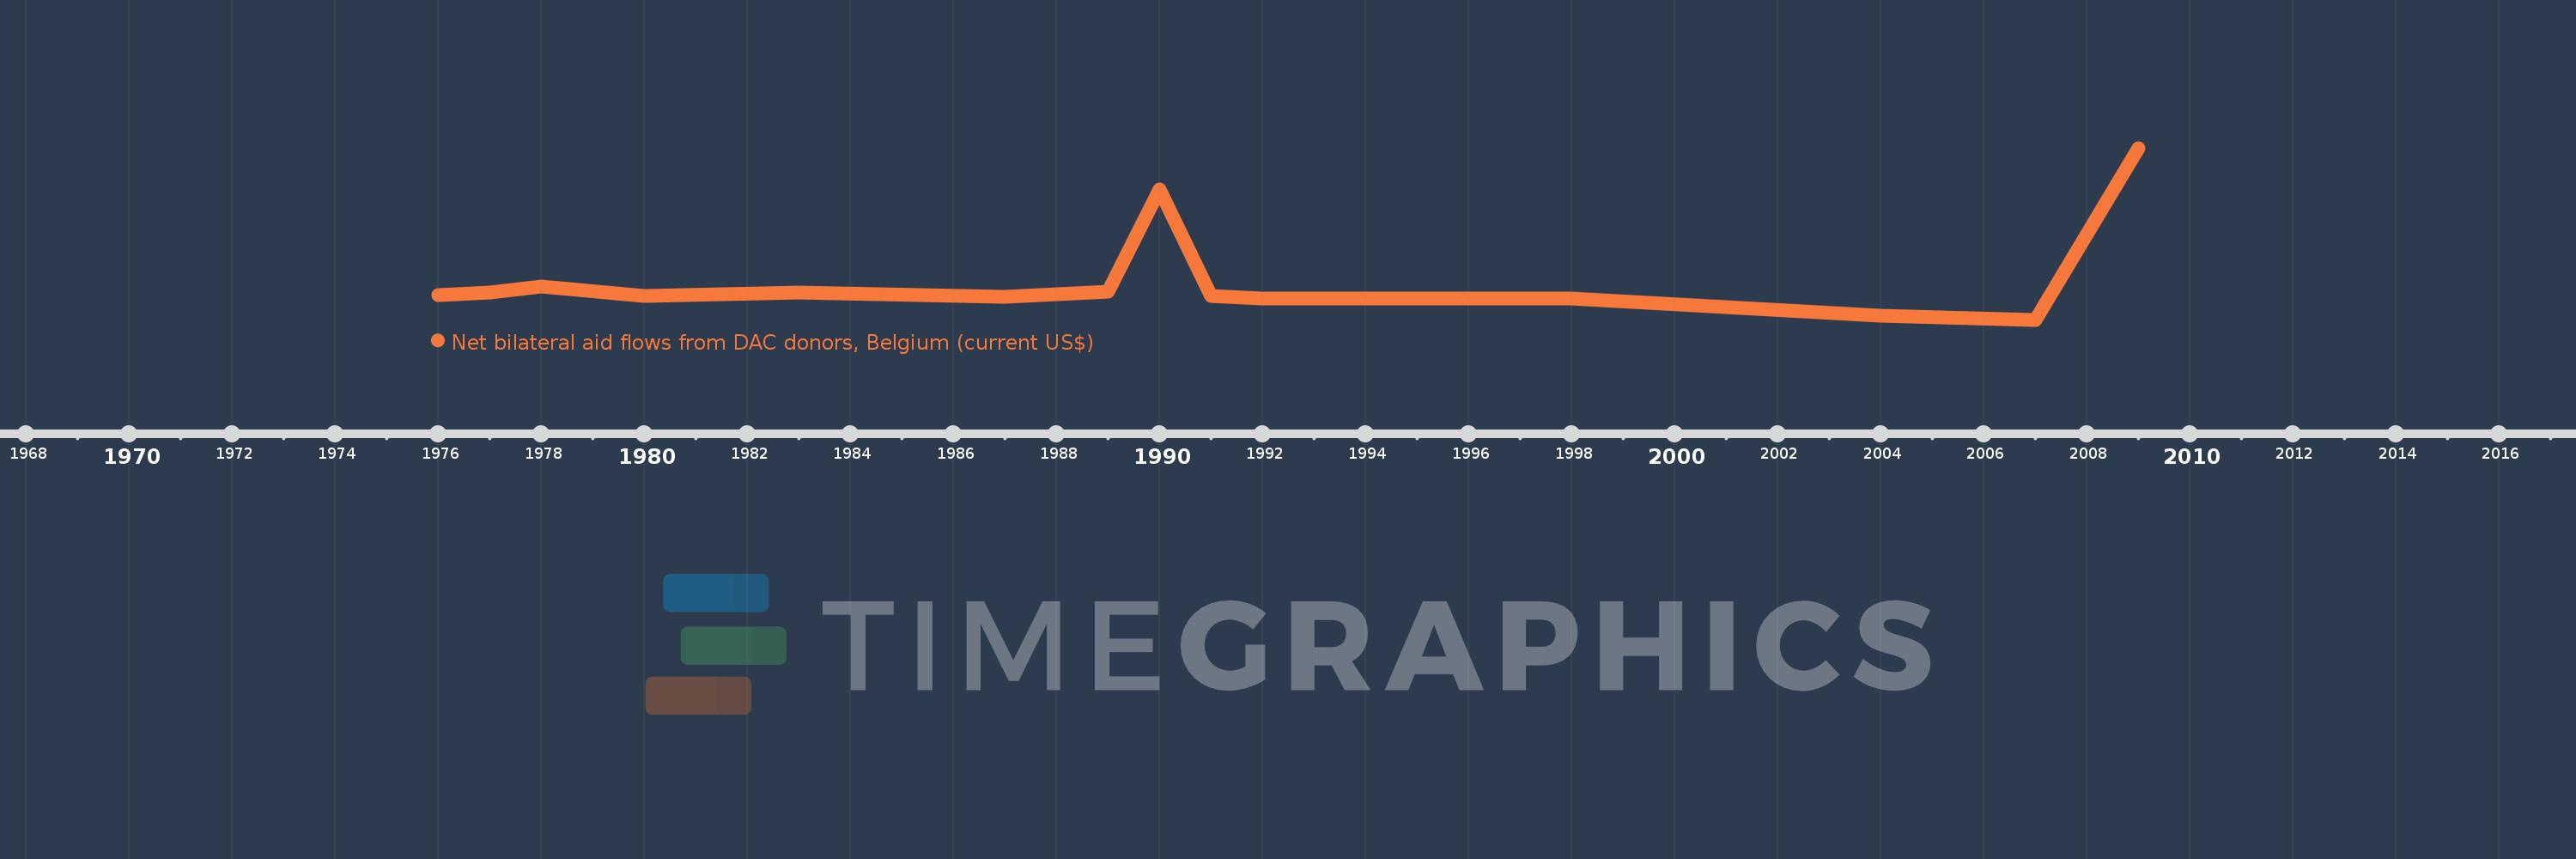
This timeline shows a graph from 1976 to 2009 of Sao Tome and Principe. No data until 1975. Number of actual observations by date: 18.
Source name:
World Development Indicators
Source organization:
Development Assistance Committee of the Organisation for Economic Co-operation and Development, Geographical Distribution of Financial Flows to Developing Countries, Development Co-operation Report, and International Development Statistics database. Data are available online at: www.oecd.org/dac/stats/idsonline.
Categories, topics:
Aid Effectiveness
Last updated:
apr 23, 2017
Indicators value changes by year
Meaning:
143.333K
Minimum:
-190.0K
jan 1, 2007
Maximum:
1.41 mln
jan 1, 2009
At the date of observation
Value
Absolute change
Change from the previous value
jan 1, 1976
40.0K
+40.0K
0.0%
jan 1, 1977
60.0K
+20.0K
50.0%
jan 1, 1978
120.0K
+60.0K
100.0%
jan 1, 1980
30.0K
-90.0K
-75.0%
jan 1, 1983
60.0K
+30.0K
100.0%
jan 1, 1987
20.0K
-40.0K
-66.67%
jan 1, 1989
70.0K
+50.0K
250.0%
jan 1, 1990
1.02 mln
+950.0K
1.36K%
jan 1, 1991
30.0K
-990.0K
-97.06%
jan 1, 1992
10.0K
-20.0K
-66.67%
jan 1, 1993
10.0K
0.0
0.0%
jan 1, 1994
10.0K
0.0
0.0%
jan 1, 1996
10.0K
0.0
0.0%
jan 1, 1997
10.0K
0.0
0.0%
jan 1, 1998
10.0K
0.0
0.0%
jan 1, 2004
-150.0K
-160.0K
-1.6K%
jan 1, 2007
-190.0K
-40.0K
26.67%
jan 1, 2009
1.41 mln
+1.6 mln
-842.11%
Ranking of countries by current statistics by years