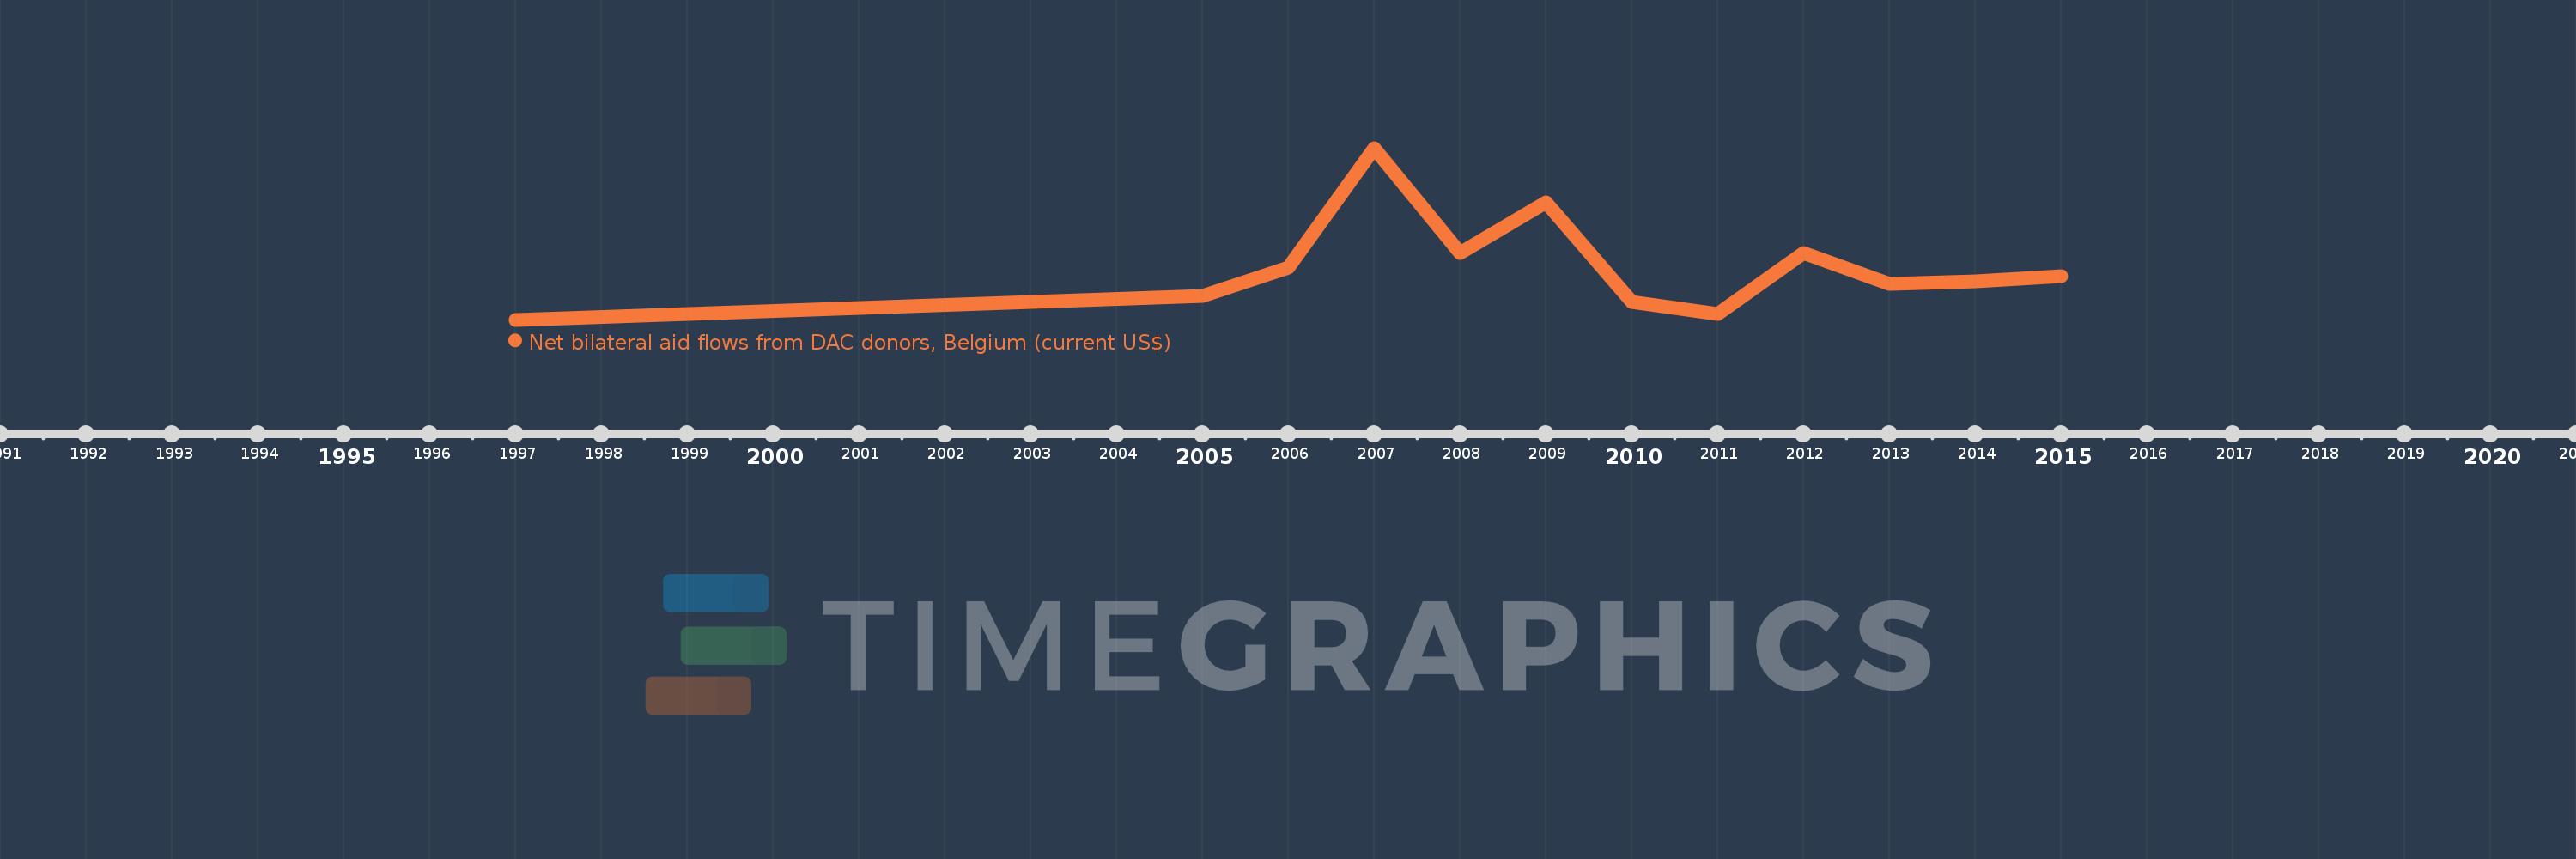
This timeline shows a graph from 1997 to 2015 of Armenia. No data until 1996. Number of actual observations by date: 12.
Source name:
World Development Indicators
Source organization:
Development Assistance Committee of the Organisation for Economic Co-operation and Development, Geographical Distribution of Financial Flows to Developing Countries, Development Co-operation Report, and International Development Statistics database. Data are available online at: www.oecd.org/dac/stats/idsonline.
Categories, topics:
Aid Effectiveness
Last updated:
apr 23, 2017
Indicators value changes by year
Meaning:
295.0K
Minimum:
0.0
jan 1, 1997
Maximum:
950.0K
jan 1, 2007
At the date of observation
Value
Absolute change
Change from the previous value
jan 1, 1997
0.0
0.0
0.0%
jan 1, 2005
130.0K
+130.0K
%
jan 1, 2006
290.0K
+160.0K
123.08%
jan 1, 2007
950.0K
+660.0K
227.59%
jan 1, 2008
370.0K
-580.0K
-61.05%
jan 1, 2009
650.0K
+280.0K
75.68%
jan 1, 2010
100.0K
-550.0K
-84.62%
jan 1, 2011
30.0K
-70.0K
-70.0%
jan 1, 2012
370.0K
+340.0K
1.13K%
jan 1, 2013
200.0K
-170.0K
-45.95%
jan 1, 2014
210.0K
+10.0K
5.0%
jan 1, 2015
240.0K
+30.0K
14.29%
Ranking of countries by current statistics by years