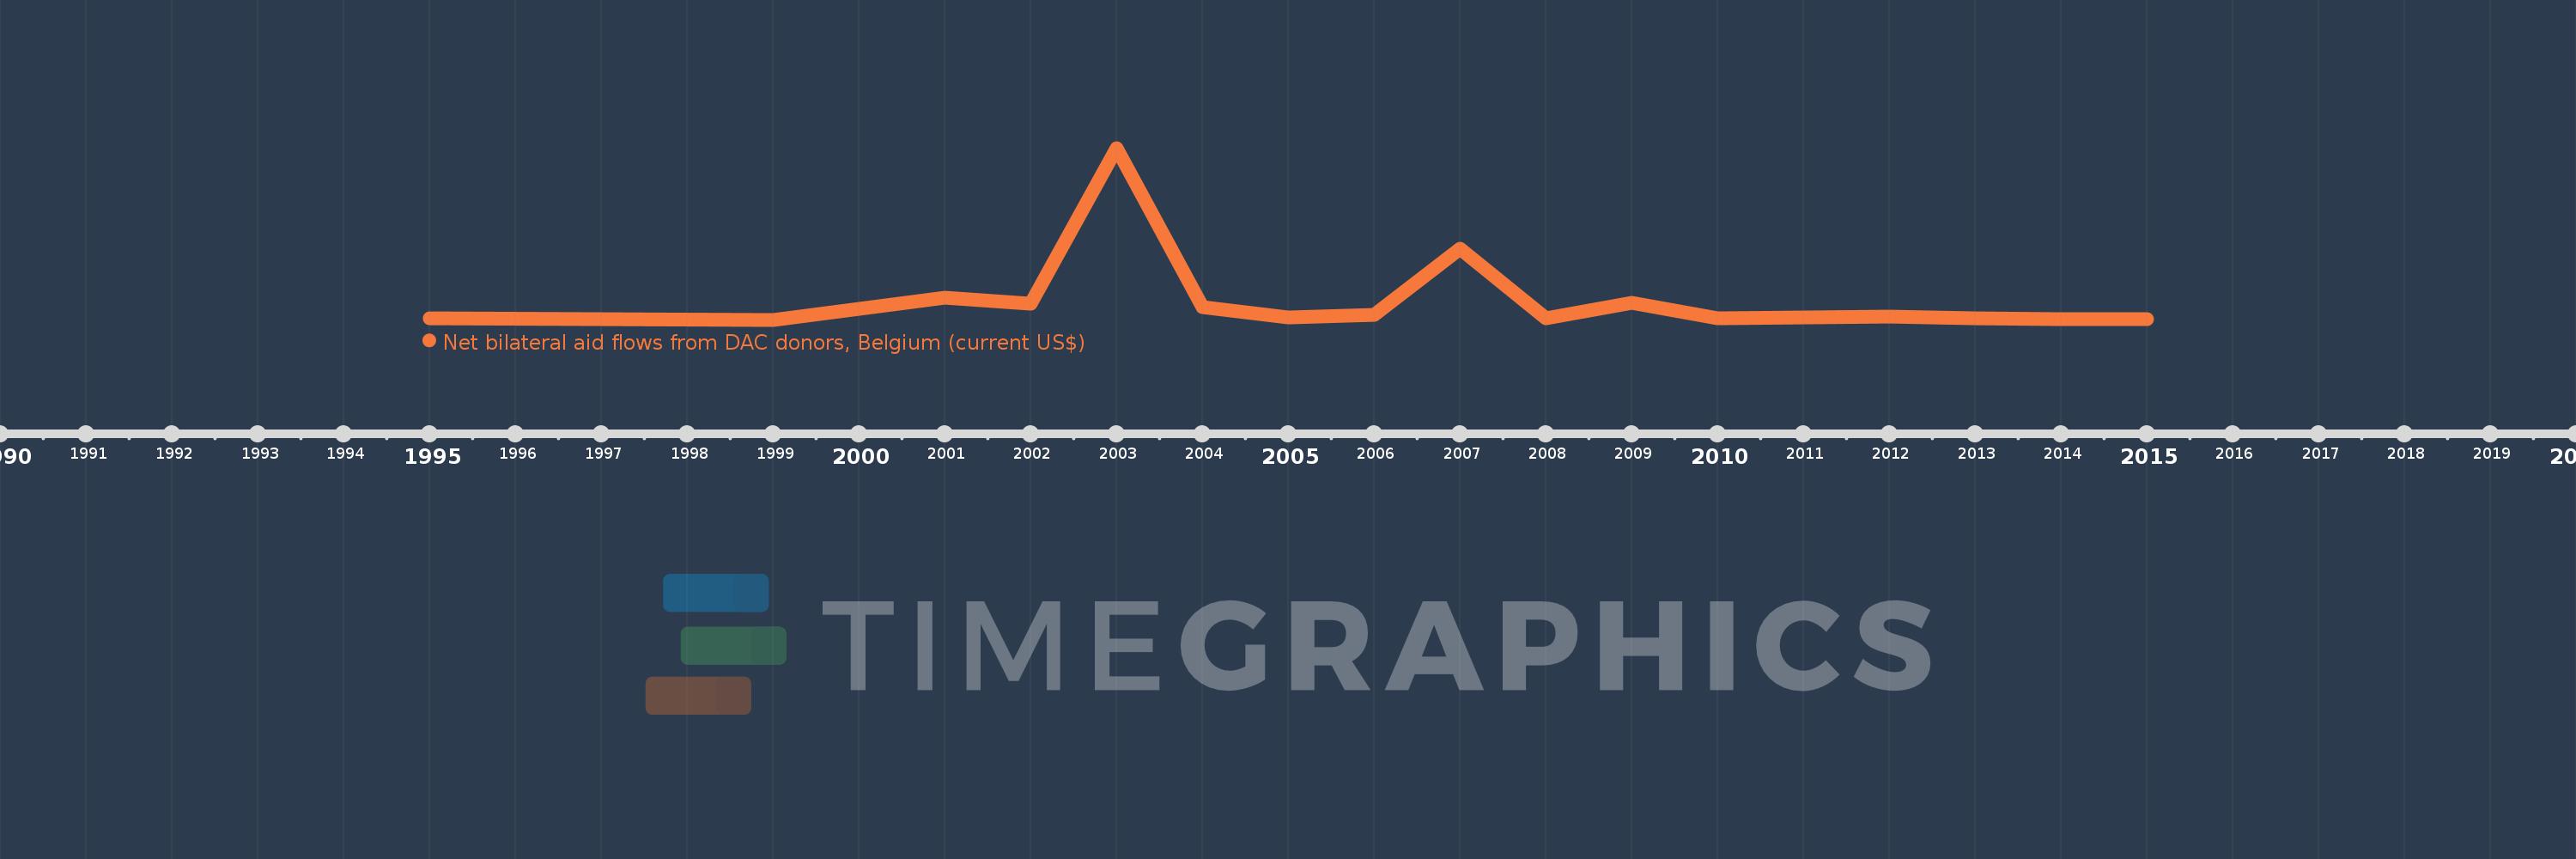
This timeline shows a graph from 1995 to 2015 of Serbia. No data until 1994. Number of actual observations by date: 18.
Source name:
World Development Indicators
Source organization:
Development Assistance Committee of the Organisation for Economic Co-operation and Development, Geographical Distribution of Financial Flows to Developing Countries, Development Co-operation Report, and International Development Statistics database. Data are available online at: www.oecd.org/dac/stats/idsonline.
Categories, topics:
Aid Effectiveness
Last updated:
apr 23, 2017
Indicators value changes by year
Meaning:
5.829 mln
Minimum:
130.0K
jan 1, 1999
Maximum:
51.91 mln
jan 1, 2003
At the date of observation
Value
Absolute change
Change from the previous value
jan 1, 1995
510.0K
+510.0K
0.0%
jan 1, 1999
130.0K
-380.0K
-74.51%
jan 1, 2000
3.34 mln
+3.21 mln
2.47K%
jan 1, 2001
6.75 mln
+3.41 mln
102.1%
jan 1, 2002
4.86 mln
-1.89 mln
-28.0%
jan 1, 2003
51.91 mln
+47.05 mln
968.11%
jan 1, 2004
4.03 mln
-47.88 mln
-92.24%
jan 1, 2005
770.0K
-3.26 mln
-80.89%
jan 1, 2006
1.53 mln
+760.0K
98.7%
jan 1, 2007
21.61 mln
+20.08 mln
1.31K%
jan 1, 2008
560.0K
-21.05 mln
-97.41%
jan 1, 2009
5.19 mln
+4.63 mln
826.79%
jan 1, 2010
500.0K
-4.69 mln
-90.37%
jan 1, 2011
880.0K
+380.0K
76.0%
jan 1, 2012
1.2 mln
+320.0K
36.36%
jan 1, 2013
660.0K
-540.0K
-45.0%
jan 1, 2014
230.0K
-430.0K
-65.15%
jan 1, 2015
260.0K
+30.0K
13.04%
Ranking of countries by current statistics by years