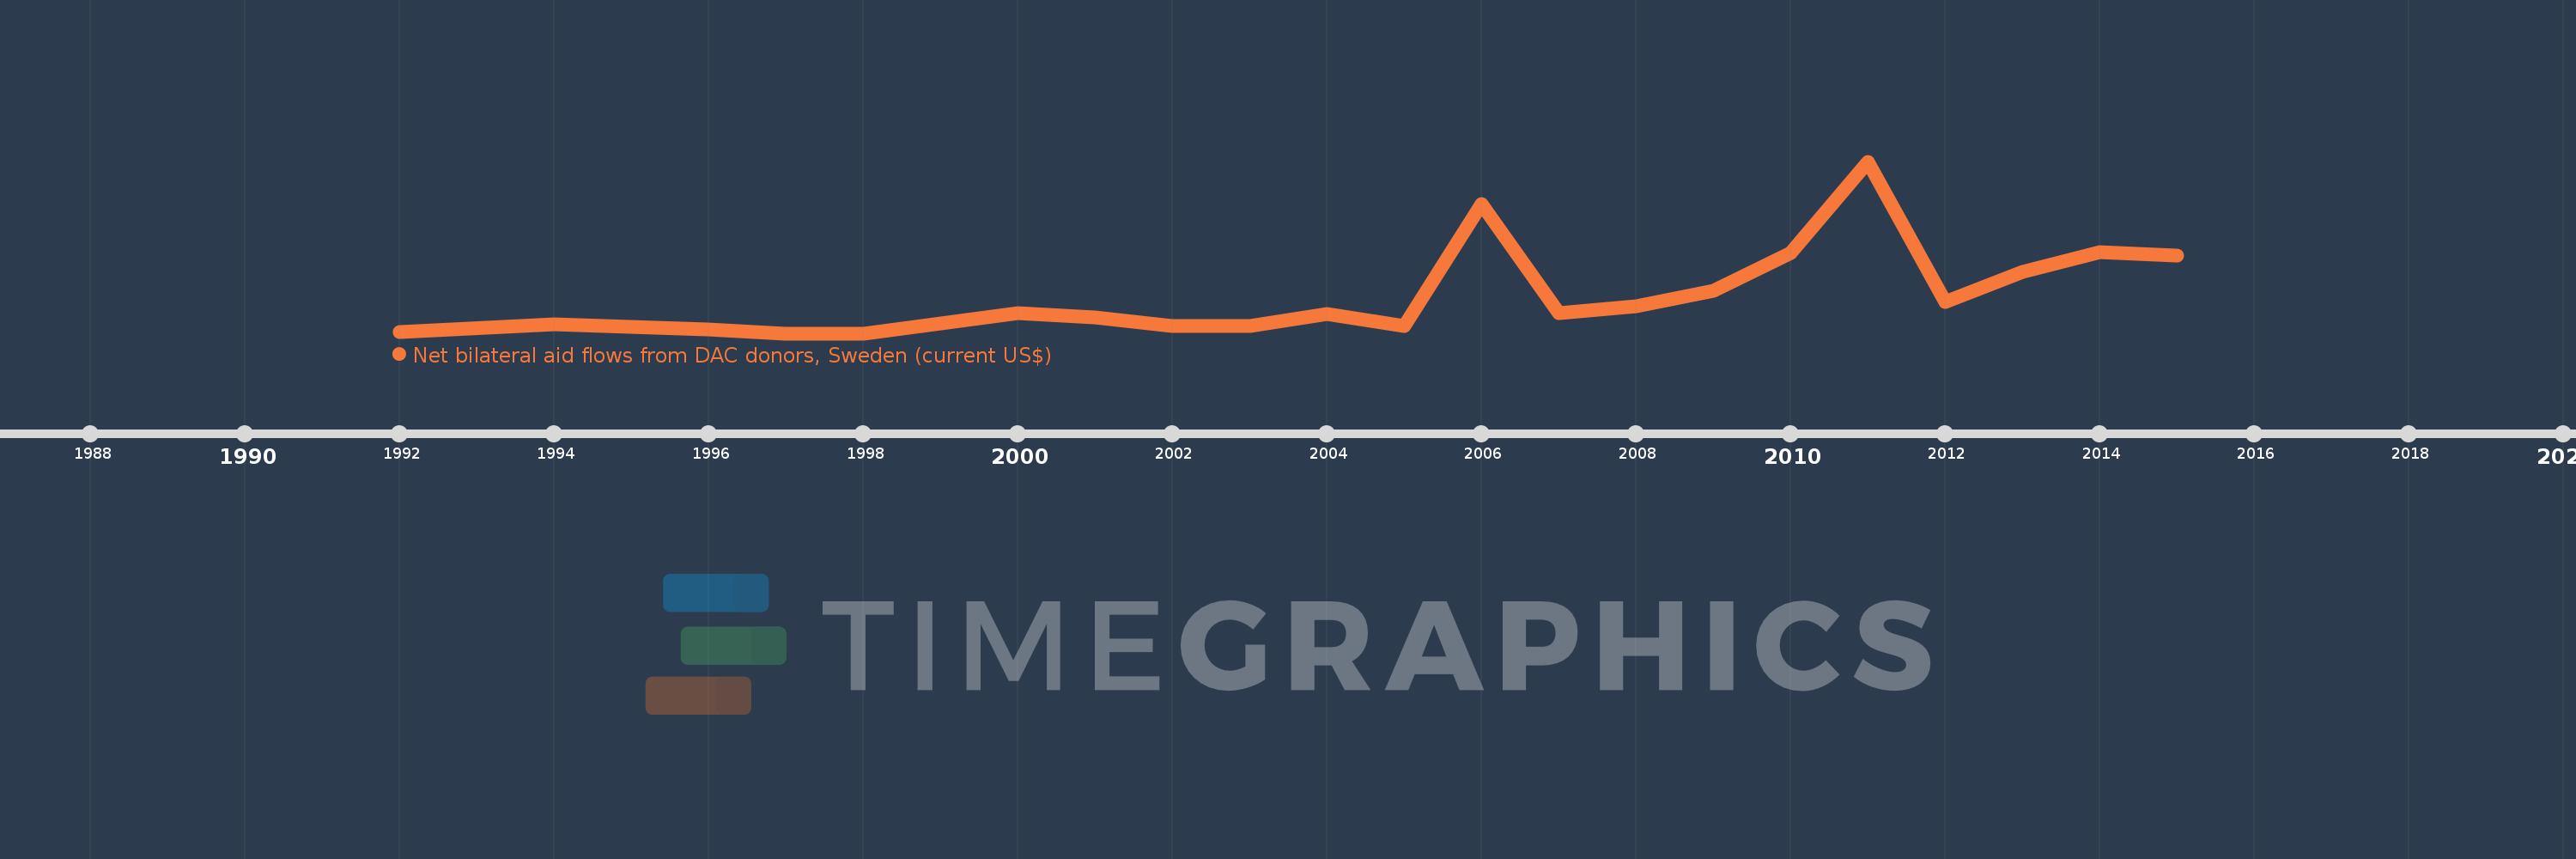
This timeline shows a graph from 1992 to 2015 of Benin. No data until 1991. Number of actual observations by date: 21.
Source name:
World Development Indicators
Source organization:
Development Assistance Committee of the Organisation for Economic Co-operation and Development, Geographical Distribution of Financial Flows to Developing Countries, Development Co-operation Report, and International Development Statistics database. Data are available online at: www.oecd.org/dac/stats/idsonline.
Categories, topics:
Aid Effectiveness
Last updated:
apr 23, 2017
Indicators value changes by year
Meaning:
431.429K
Minimum:
10.0K
jan 1, 1997
Maximum:
1.88 mln
jan 1, 2011
At the date of observation
Value
Absolute change
Change from the previous value
jan 1, 1992
20.0K
+20.0K
0.0%
jan 1, 1994
110.0K
+90.0K
450.0%
jan 1, 1996
50.0K
-60.0K
-54.55%
jan 1, 1997
10.0K
-40.0K
-80.0%
jan 1, 1998
10.0K
0.0
0.0%
jan 1, 2000
230.0K
+220.0K
2.2K%
jan 1, 2001
180.0K
-50.0K
-21.74%
jan 1, 2002
90.0K
-90.0K
-50.0%
jan 1, 2003
90.0K
0.0
0.0%
jan 1, 2004
220.0K
+130.0K
144.44%
jan 1, 2005
90.0K
-130.0K
-59.09%
jan 1, 2006
1.42 mln
+1.33 mln
1.48K%
jan 1, 2007
230.0K
-1.19 mln
-83.8%
jan 1, 2008
300.0K
+70.0K
30.43%
jan 1, 2009
470.0K
+170.0K
56.67%
jan 1, 2010
880.0K
+410.0K
87.23%
jan 1, 2011
1.88 mln
+1000.0K
113.64%
jan 1, 2012
350.0K
-1.53 mln
-81.38%
jan 1, 2013
680.0K
+330.0K
94.29%
jan 1, 2014
890.0K
+210.0K
30.88%
jan 1, 2015
860.0K
-30.0K
-3.37%
Ranking of countries by current statistics by years