33
/
AIzaSyAYiBZKx7MnpbEhh9jyipgxe19OcubqV5w
August 1, 2025
75356
Azerbaijan
AZE
true
2
1
Net bilateral aid flows from DAC donors, Sweden (current US$)
2015,2014,2013,2012,2011,2010,2009,2008,2007,2006,2005,2004,2003,2002,2001,2000,1999,1998,1997,1996,1995
Download
Global statistics library →Azerbaijan →

Net bilateral aid flows from DAC donors, Sweden (current US$)

This statistics in other country:

AfghanistanAlbaniaAlgeriaAngolaAntigua and BarbudaArab WorldArgentinaArmeniaAzerbaijanBangladeshBelarusBelizeBeninBhutanBoliviaBosnia and HerzegovinaBotswanaBrazilBrunei DarussalamBulgariaBurkina FasoBurundiCabo VerdeCambodiaCameroonCaribbean small statesCentral African RepublicCentral Europe and the BalticsChadChileChinaColombiaComorosCongo, Dem. Rep.Congo, Rep.Costa RicaCote d'IvoireCroatiaCubaCyprusCzech RepublicDjiboutiDominicaDominican RepublicEast Asia & PacificEast Asia & Pacific (excluding high income)East Asia & Pacific (IDA & IBRD countries)EcuadorEgypt, Arab Rep.El SalvadorEquatorial GuineaEritreaEstoniaEthiopiaEuro areaEurope & Central AsiaEurope & Central Asia (excluding high income)Europe & Central Asia (IDA & IBRD countries)European UnionFijiFragile and conflict affected situationsGabonGambia, TheGeorgiaGhanaGrenadaGuatemalaGuineaGuinea-BissauGuyanaHaitiHeavily indebted poor countries (HIPC)High incomeHondurasHong Kong SAR, ChinaHungaryIBRD onlyIDA & IBRD totalIDA blendIDA onlyIDA totalIndiaIndonesiaIran, Islamic Rep.IraqIsraelJamaicaJordanKazakhstanKenyaKorea, Dem. People’s Rep.Korea, Rep.KosovoKuwaitKyrgyz RepublicLao PDRLatin America & Caribbean Latin America & Caribbean (excluding high income)Latin America & the Caribbean (IDA & IBRD countries)LatviaLeast developed countries: UN classificationLebanonLesothoLiberiaLibyaLithuaniaLow & middle incomeLow incomeLower middle incomeMacao SAR, ChinaMacedonia, FYRMadagascarMalawiMalaysiaMaldivesMaliMarshall IslandsMauritaniaMauritiusMexicoMicronesia, Fed. Sts.Middle East & North AfricaMiddle East & North Africa (excluding high income)Middle East & North Africa (IDA & IBRD countries)Middle incomeMoldovaMongoliaMontenegroMoroccoMozambiqueMyanmarNamibiaNepalNicaraguaNigerNigeriaOECD membersOther small statesPacific island small statesPakistanPanamaPapua New GuineaParaguayPeruPhilippinesPolandRomaniaRussian FederationRwandaSamoaSao Tome and PrincipeSaudi ArabiaSenegalSerbiaSeychellesSierra LeoneSingaporeSlovak RepublicSloveniaSmall statesSolomon IslandsSomaliaSouth AfricaSouth AsiaSouth Asia (IDA & IBRD)South SudanSri LankaSt. Kitts and NevisSt. LuciaSt. Vincent and the GrenadinesSub-Saharan Africa Sub-Saharan Africa (excluding high income)Sub-Saharan Africa (IDA & IBRD countries)SudanSurinameSwazilandSyrian Arab RepublicTajikistanTanzaniaThailandTimor-LesteTogoTrinidad and TobagoTunisiaTurkeyTurkmenistanUgandaUkraineUpper middle incomeUruguayUzbekistanVanuatuVenezuela, RBVietnamWest Bank and GazaWorldYemen, Rep.ZambiaZimbabwe

Timeline:

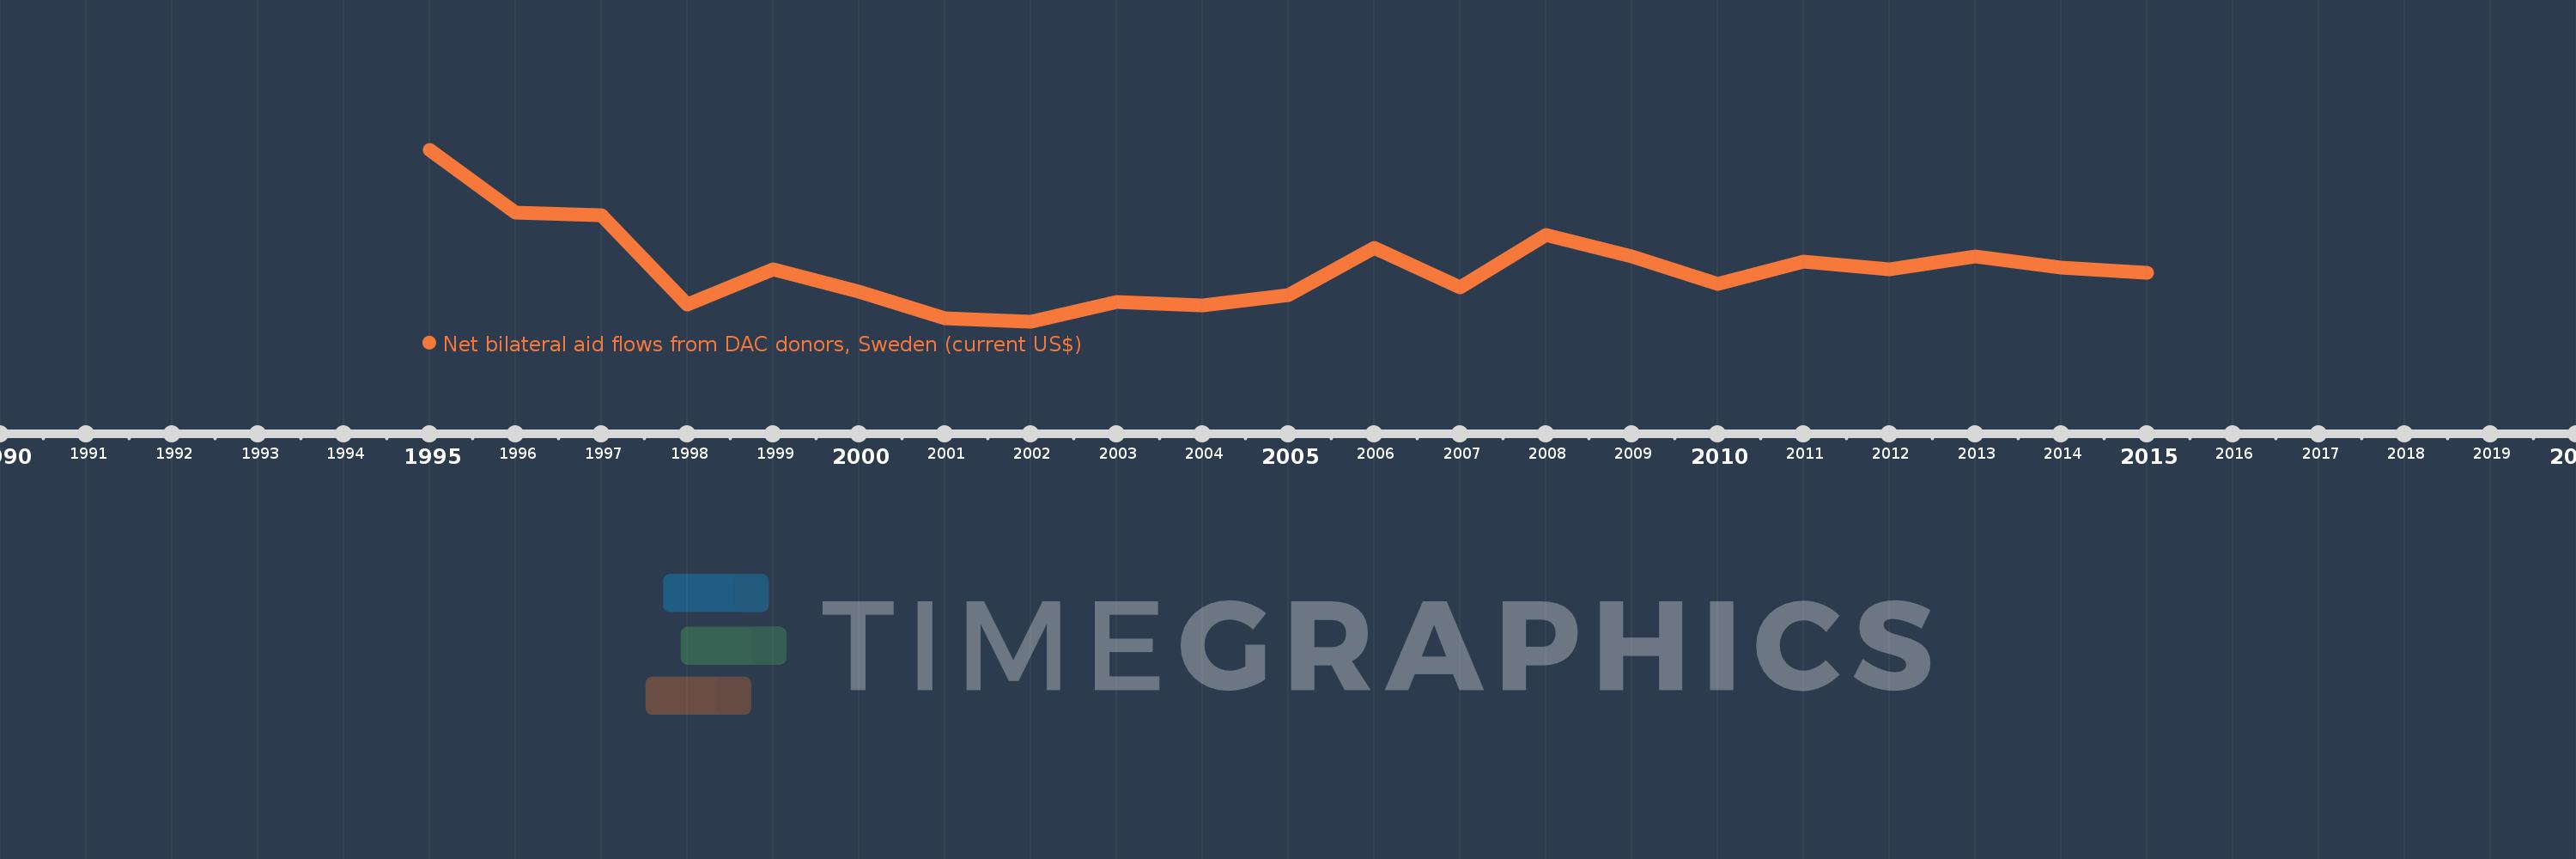
This timeline shows a graph from 1995 to 2015 of Azerbaijan. No data until 1994. Number of actual observations by date: 21.

Source name:

World Development Indicators

Source organization:

Development Assistance Committee of the Organisation for Economic Co-operation and Development, Geographical Distribution of Financial Flows to Developing Countries, Development Co-operation Report, and International Development Statistics database. Data are available online at: www.oecd.org/dac/stats/idsonline.

Categories, topics:

Aid Effectiveness

Last updated:

apr 23, 2017

Indicators value changes by year

Meaning:
864.762K
Minimum:
70.0K
jan 1, 2002
Maximum:
2.59 mln
jan 1, 1995
At the date of observation
Value
Absolute change
Change from the previous value
jan 1, 1995
2.59 mln
+2.59 mln
0.0%
jan 1, 1996
1.68 mln
-910.0K
-35.14%
jan 1, 1997
1.63 mln
-50.0K
-2.98%
jan 1, 1998
330.0K
-1.3 mln
-79.75%
jan 1, 1999
840.0K
+510.0K
154.55%
jan 1, 2000
510.0K
-330.0K
-39.29%
jan 1, 2001
130.0K
-380.0K
-74.51%
jan 1, 2002
70.0K
-60.0K
-46.15%
jan 1, 2003
360.0K
+290.0K
414.29%
jan 1, 2004
310.0K
-50.0K
-13.89%
jan 1, 2005
470.0K
+160.0K
51.61%
jan 1, 2006
1.16 mln
+690.0K
146.81%
jan 1, 2007
580.0K
-580.0K
-50.0%
jan 1, 2008
1.35 mln
+770.0K
132.76%
jan 1, 2009
1.03 mln
-320.0K
-23.7%
jan 1, 2010
630.0K
-400.0K
-38.83%
jan 1, 2011
960.0K
+330.0K
52.38%
jan 1, 2012
840.0K
-120.0K
-12.5%
jan 1, 2013
1.03 mln
+190.0K
22.62%
jan 1, 2014
870.0K
-160.0K
-15.53%
jan 1, 2015
790.0K
-80.0K
-9.2%

Ranking of countries by current statistics by years