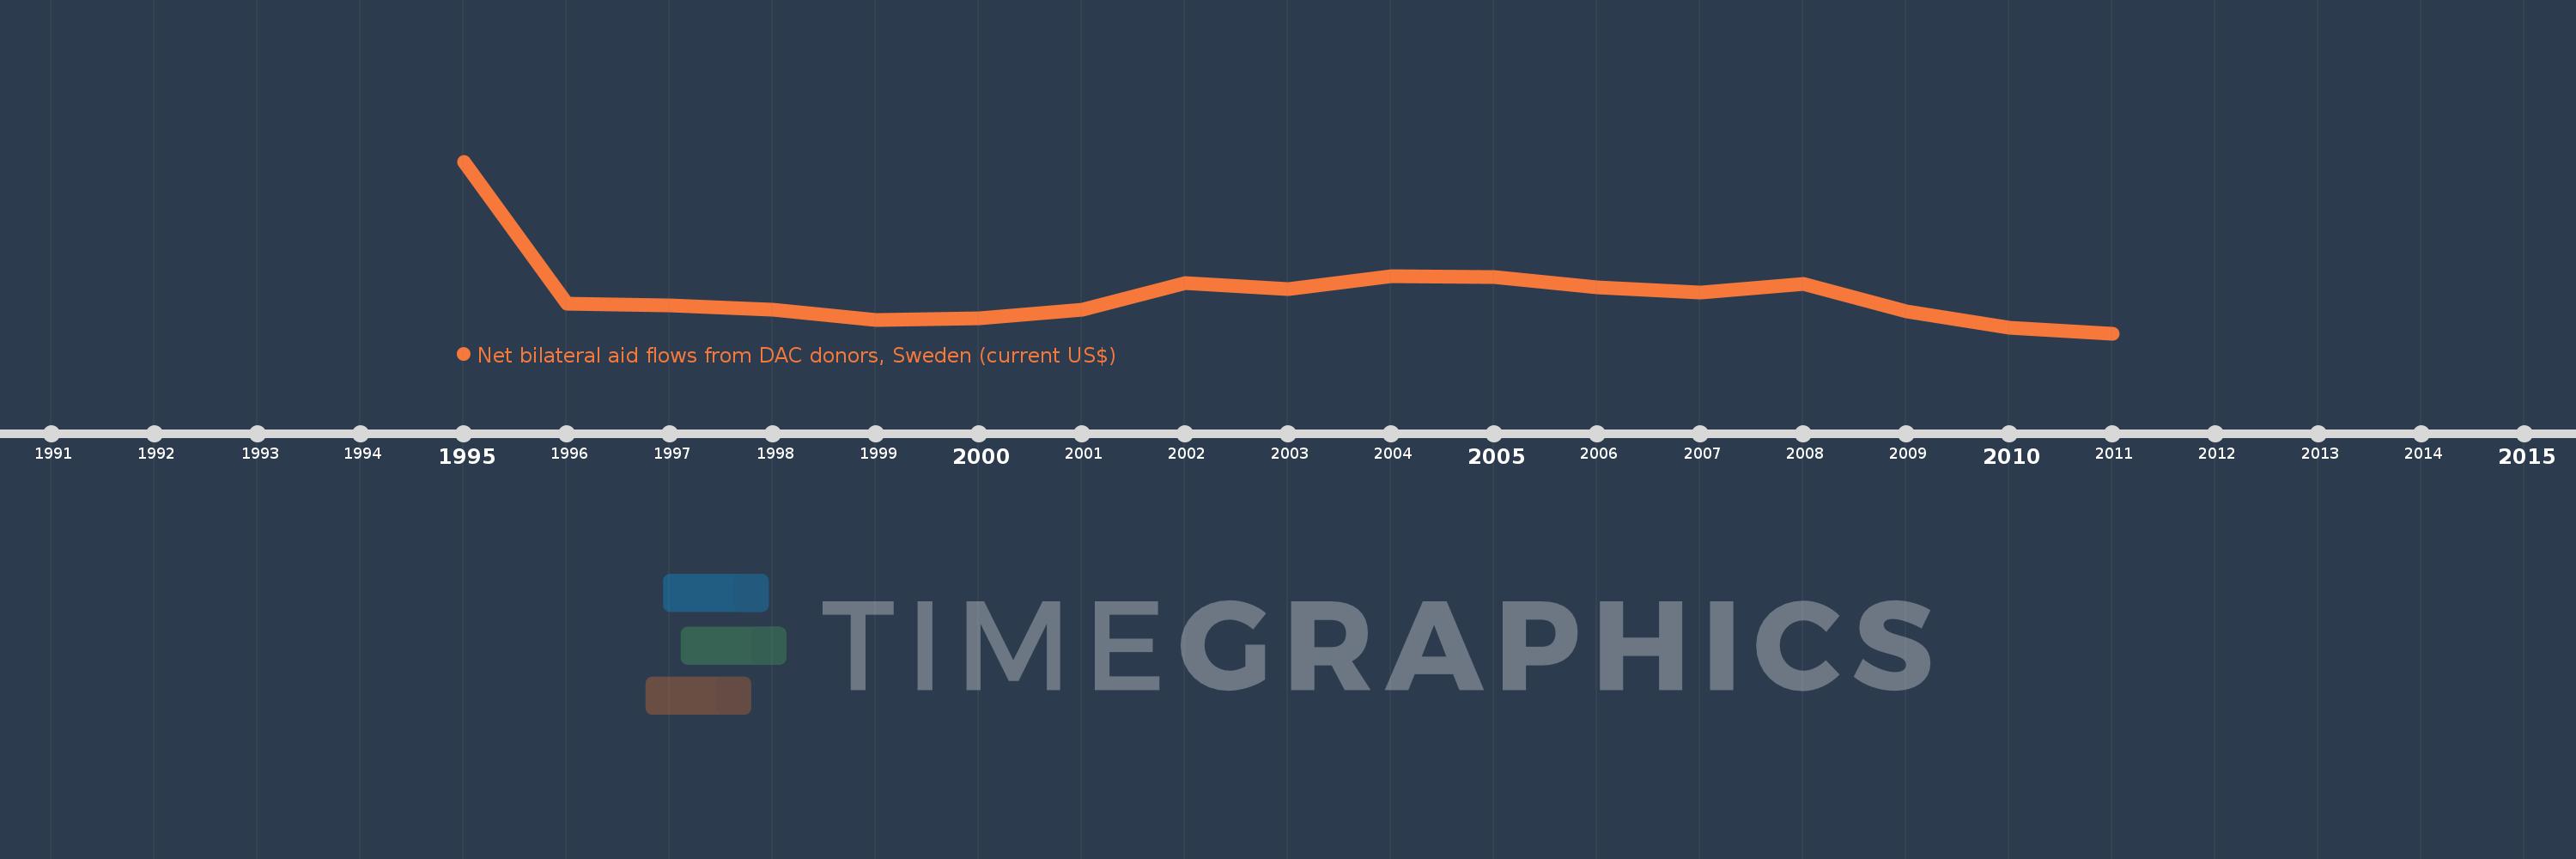
This timeline shows a graph from 1995 to 2011 of Croatia. No data until 1994. Number of actual observations by date: 17.
Source name:
World Development Indicators
Source organization:
Development Assistance Committee of the Organisation for Economic Co-operation and Development, Geographical Distribution of Financial Flows to Developing Countries, Development Co-operation Report, and International Development Statistics database. Data are available online at: www.oecd.org/dac/stats/idsonline.
Categories, topics:
Aid Effectiveness
Last updated:
apr 23, 2017
Indicators value changes by year
Meaning:
4.909 mln
Minimum:
80.0K
jan 1, 2011
Maximum:
20.93 mln
jan 1, 1995
At the date of observation
Value
Absolute change
Change from the previous value
jan 1, 1995
20.93 mln
+20.93 mln
0.0%
jan 1, 1996
3.69 mln
-17.24 mln
-82.37%
jan 1, 1997
3.43 mln
-260.0K
-7.05%
jan 1, 1998
2.99 mln
-440.0K
-12.83%
jan 1, 1999
1.65 mln
-1.34 mln
-44.82%
jan 1, 2000
1.92 mln
+270.0K
16.36%
jan 1, 2001
2.94 mln
+1.02 mln
53.13%
jan 1, 2002
6.2 mln
+3.26 mln
110.88%
jan 1, 2003
5.46 mln
-740.0K
-11.94%
jan 1, 2004
7.02 mln
+1.56 mln
28.57%
jan 1, 2005
6.93 mln
-90.0K
-1.28%
jan 1, 2006
5.62 mln
-1.31 mln
-18.9%
jan 1, 2007
5.06 mln
-560.0K
-9.96%
jan 1, 2008
6.1 mln
+1.04 mln
20.55%
jan 1, 2009
2.72 mln
-3.38 mln
-55.41%
jan 1, 2010
710.0K
-2.01 mln
-73.9%
jan 1, 2011
80.0K
-630.0K
-88.73%
Ranking of countries by current statistics by years