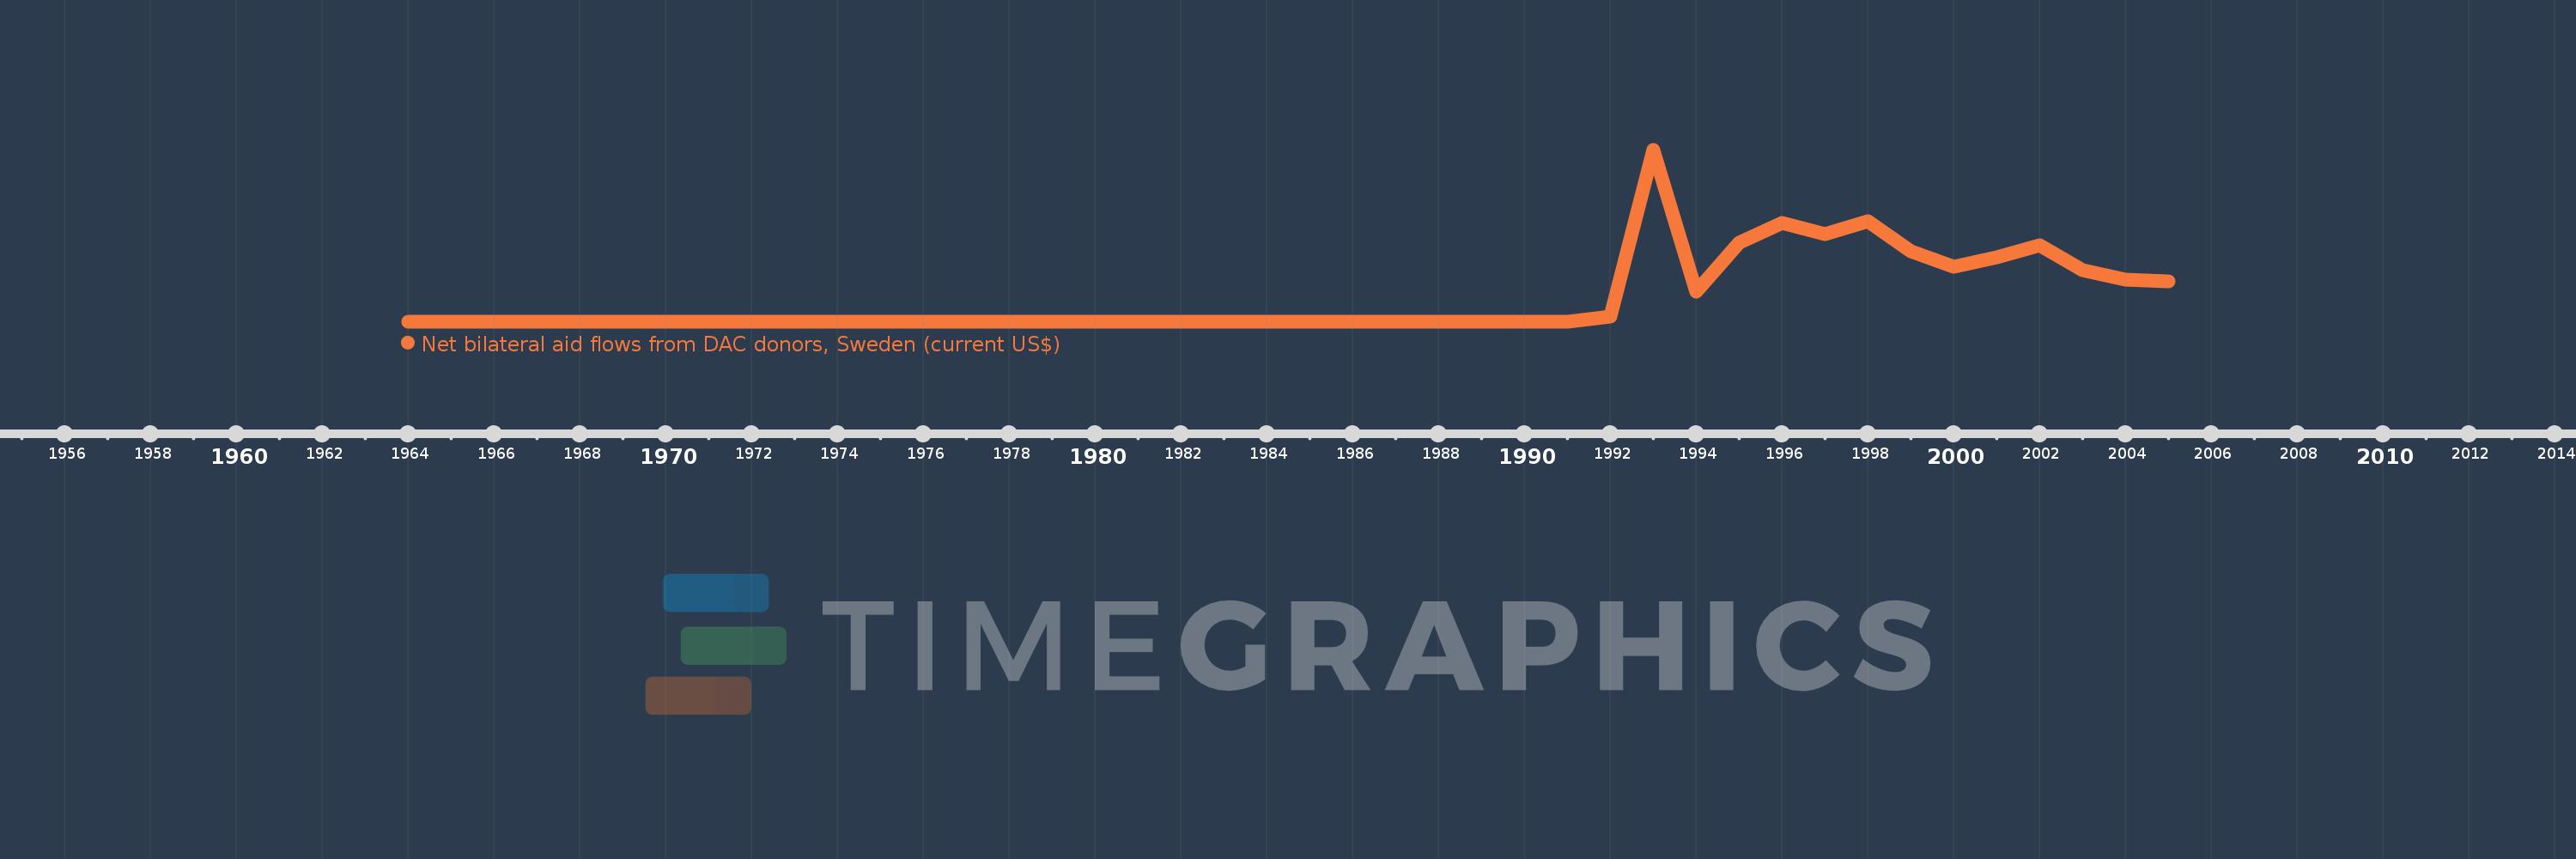
This timeline shows a graph from 1964 to 2005 of Euro area. No data until 1963. Number of actual observations by date: 18.
Source name:
World Development Indicators
Source organization:
Development Assistance Committee of the Organisation for Economic Co-operation and Development, Geographical Distribution of Financial Flows to Developing Countries, Development Co-operation Report, and International Development Statistics database. Data are available online at: www.oecd.org/dac/stats/idsonline.
Categories, topics:
Aid Effectiveness
Last updated:
apr 23, 2017
Indicators value changes by year
Meaning:
23.576 mln
Minimum:
10.0K
jan 1, 1964
Maximum:
74.5 mln
jan 1, 1993
At the date of observation
Value
Absolute change
Change from the previous value
jan 1, 1964
10.0K
+10.0K
0.0%
jan 1, 1985
10.0K
0.0
0.0%
jan 1, 1986
20.0K
+10.0K
100.0%
jan 1, 1991
10.0K
-10.0K
-50.0%
jan 1, 1992
2.52 mln
+2.51 mln
25.1K%
jan 1, 1993
74.5 mln
+71.98 mln
2.86K%
jan 1, 1994
13.29 mln
-61.21 mln
-82.16%
jan 1, 1995
34.48 mln
+21.19 mln
159.44%
jan 1, 1996
42.97 mln
+8.49 mln
24.62%
jan 1, 1997
38.26 mln
-4.71 mln
-10.96%
jan 1, 1998
43.87 mln
+5.61 mln
14.66%
jan 1, 1999
30.79 mln
-13.08 mln
-29.82%
jan 1, 2000
23.8 mln
-6.99 mln
-22.7%
jan 1, 2001
28.14 mln
+4.34 mln
18.24%
jan 1, 2002
33.44 mln
+5.3 mln
18.83%
jan 1, 2003
22.49 mln
-10.95 mln
-32.75%
jan 1, 2004
18.27 mln
-4.22 mln
-18.76%
jan 1, 2005
17.5 mln
-770.0K
-4.21%
Ranking of countries by current statistics by years