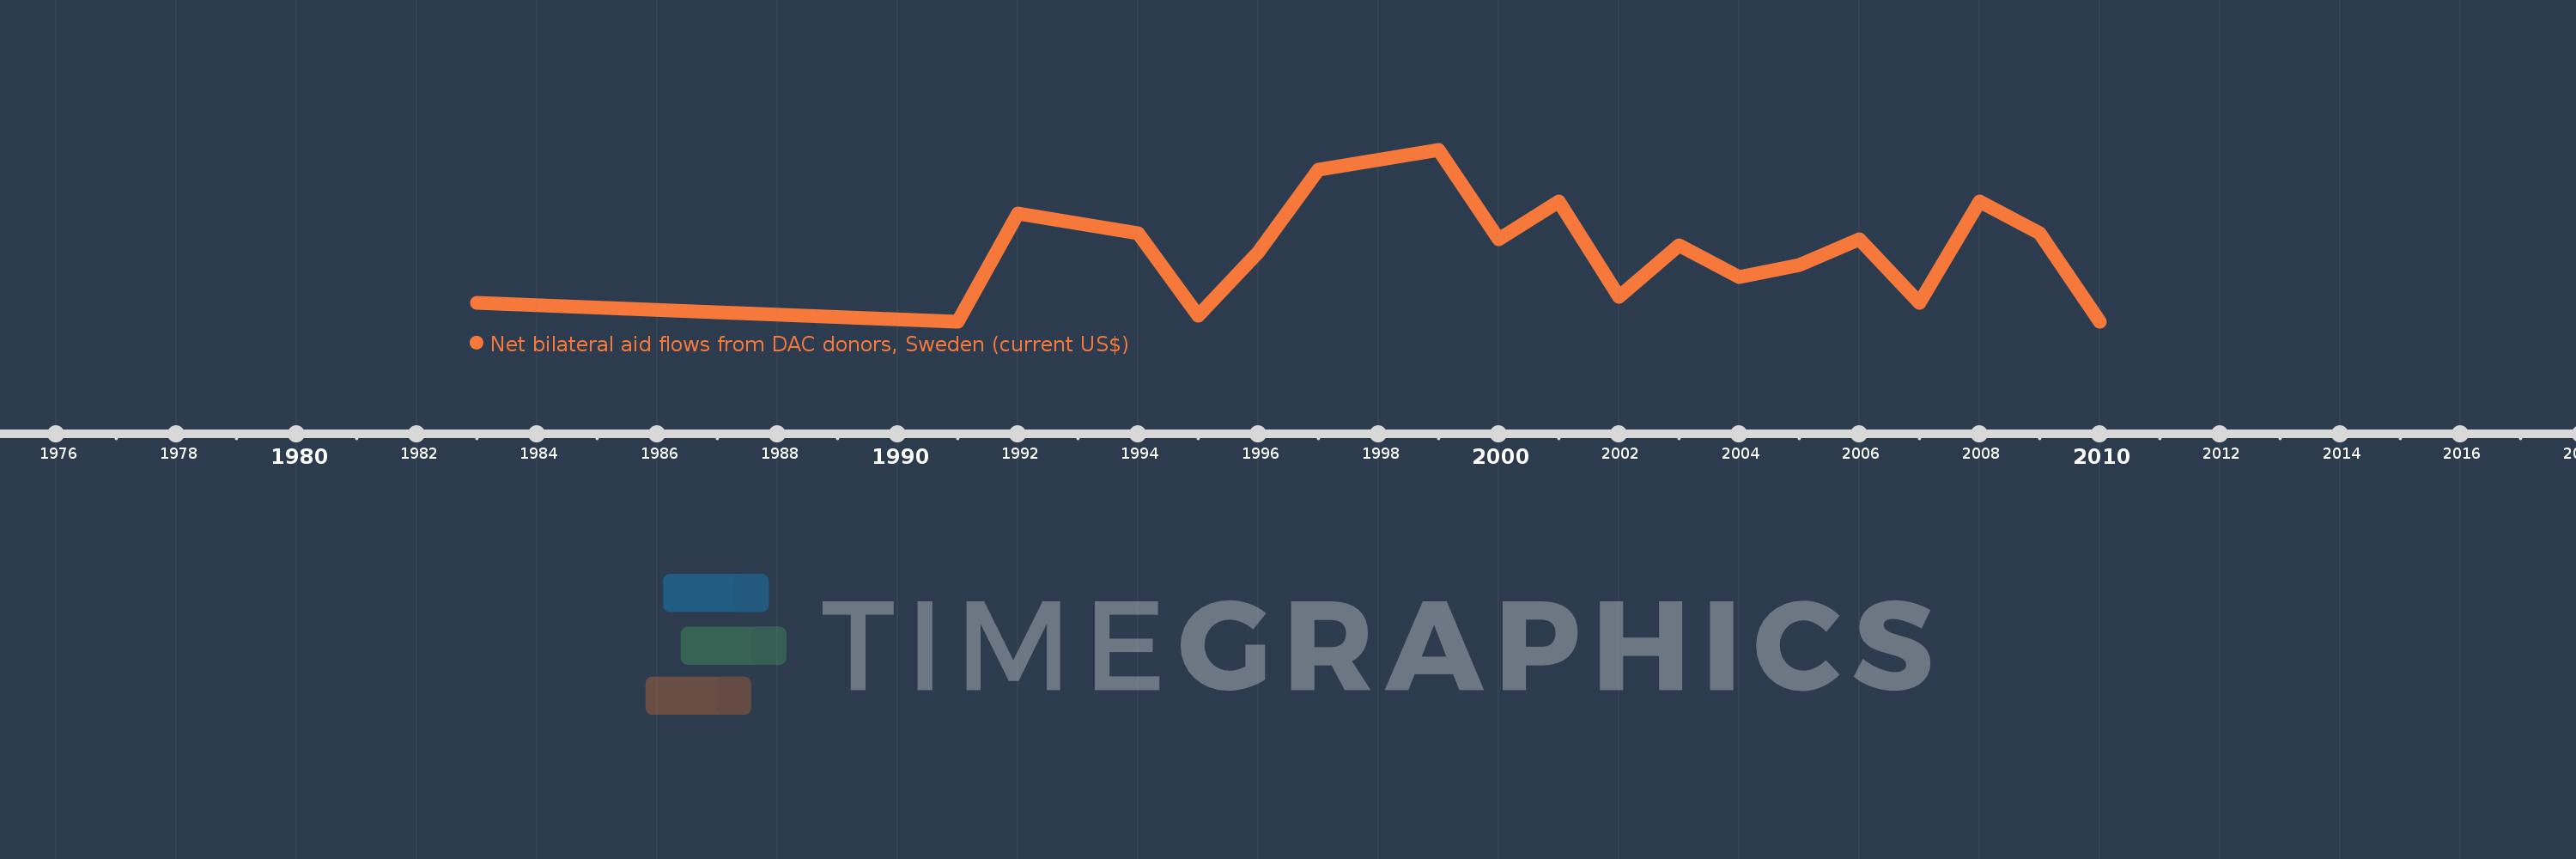
This timeline shows a graph from 1983 to 2010 of Papua New Guinea. No data until 1982. Number of actual observations by date: 19.
Source name:
World Development Indicators
Source organization:
Development Assistance Committee of the Organisation for Economic Co-operation and Development, Geographical Distribution of Financial Flows to Developing Countries, Development Co-operation Report, and International Development Statistics database. Data are available online at: www.oecd.org/dac/stats/idsonline.
Categories, topics:
Aid Effectiveness
Last updated:
apr 23, 2017
Indicators value changes by year
Meaning:
120.526K
Minimum:
10.0K
jan 1, 1991
Maximum:
280.0K
jan 1, 1999
At the date of observation
Value
Absolute change
Change from the previous value
jan 1, 1983
40.0K
+40.0K
0.0%
jan 1, 1991
10.0K
-30.0K
-75.0%
jan 1, 1992
180.0K
+170.0K
1.7K%
jan 1, 1994
150.0K
-30.0K
-16.67%
jan 1, 1995
20.0K
-130.0K
-86.67%
jan 1, 1996
120.0K
+100.0K
500.0%
jan 1, 1997
250.0K
+130.0K
108.33%
jan 1, 1999
280.0K
+30.0K
12.0%
jan 1, 2000
140.0K
-140.0K
-50.0%
jan 1, 2001
200.0K
+60.0K
42.86%
jan 1, 2002
50.0K
-150.0K
-75.0%
jan 1, 2003
130.0K
+80.0K
160.0%
jan 1, 2004
80.0K
-50.0K
-38.46%
jan 1, 2005
100.0K
+20.0K
25.0%
jan 1, 2006
140.0K
+40.0K
40.0%
jan 1, 2007
40.0K
-100.0K
-71.43%
jan 1, 2008
200.0K
+160.0K
400.0%
jan 1, 2009
150.0K
-50.0K
-25.0%
jan 1, 2010
10.0K
-140.0K
-93.33%
Ranking of countries by current statistics by years