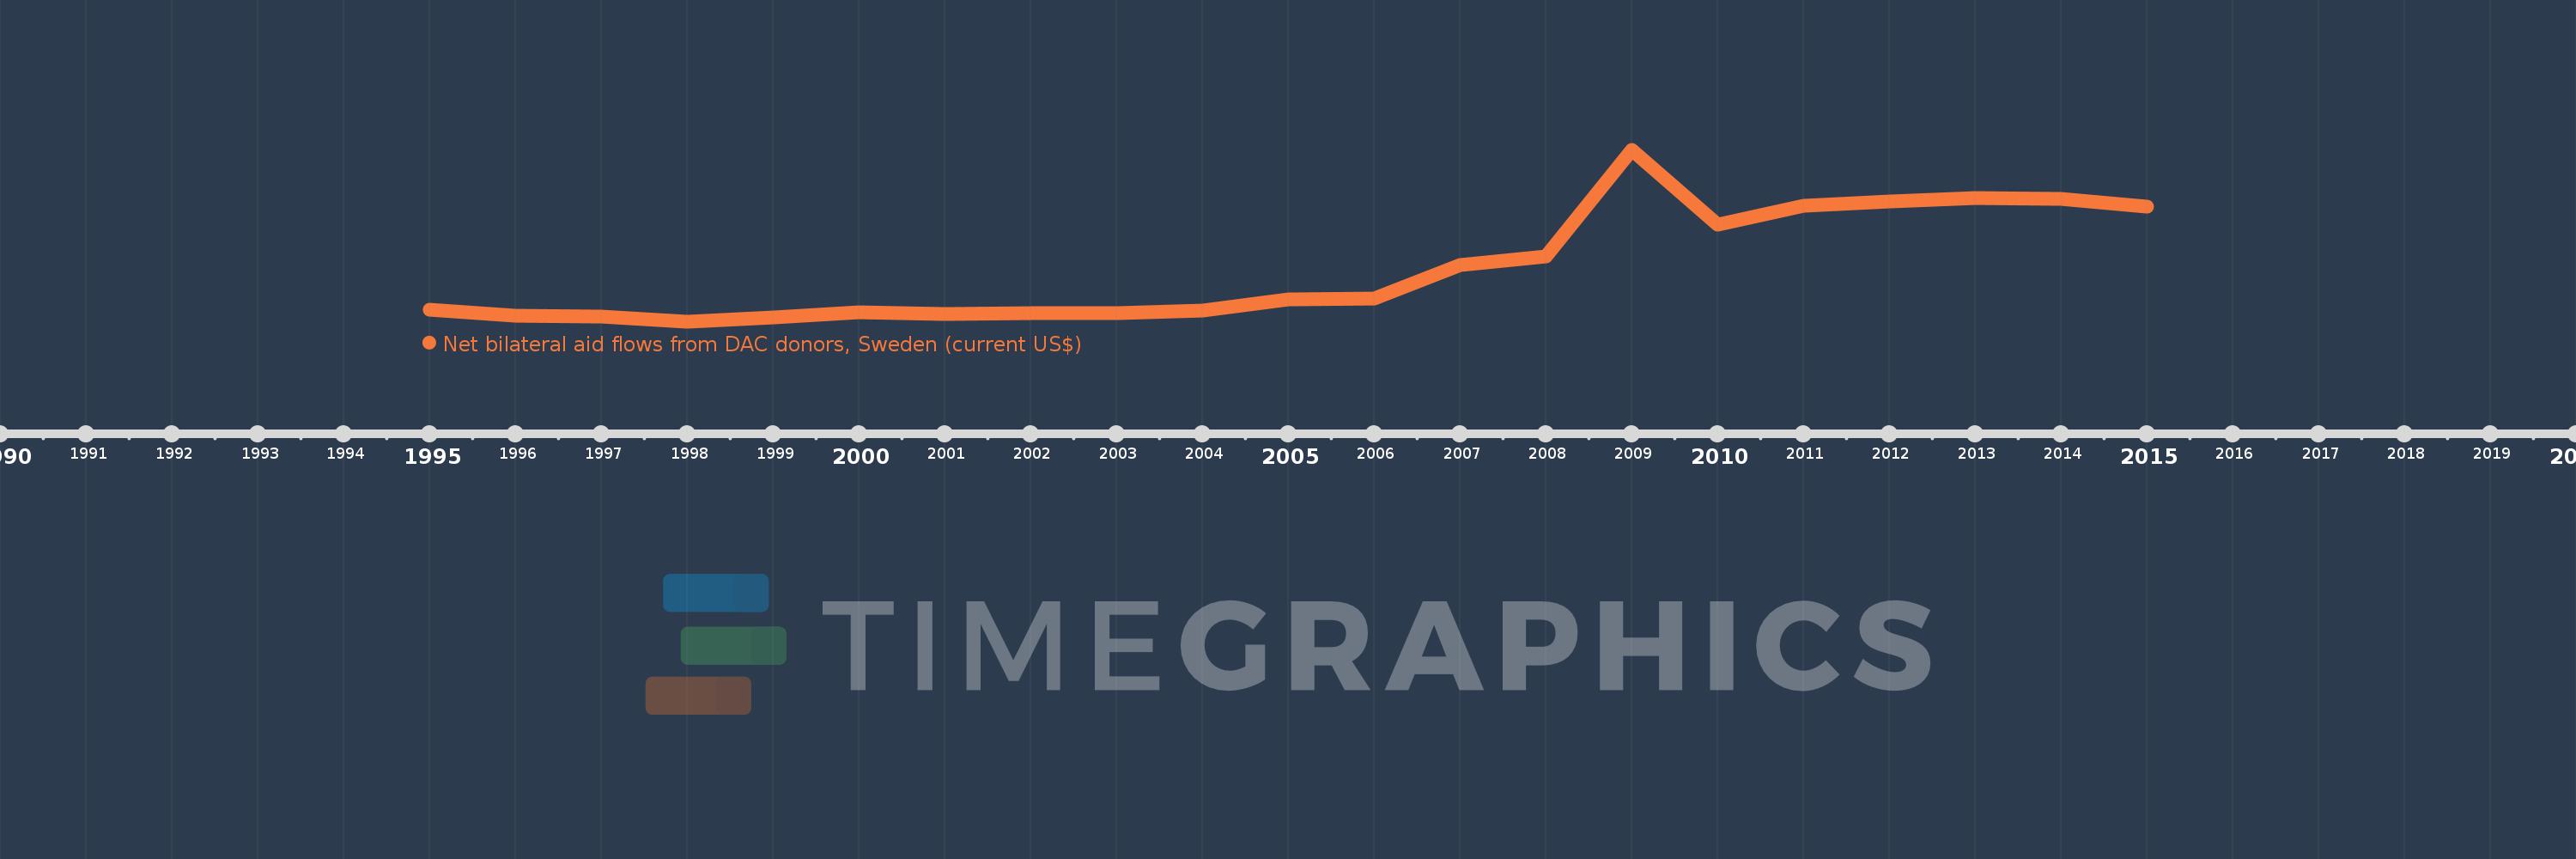
This timeline shows a graph from 1995 to 2015 of Georgia. No data until 1994. Number of actual observations by date: 21.
Source name:
World Development Indicators
Source organization:
Development Assistance Committee of the Organisation for Economic Co-operation and Development, Geographical Distribution of Financial Flows to Developing Countries, Development Co-operation Report, and International Development Statistics database. Data are available online at: www.oecd.org/dac/stats/idsonline.
Categories, topics:
Aid Effectiveness
Last updated:
apr 23, 2017
Indicators value changes by year
Meaning:
8.808 mln
Minimum:
590.0K
jan 1, 1998
Maximum:
27.25 mln
jan 1, 2009
At the date of observation
Value
Absolute change
Change from the previous value
jan 1, 1995
2.56 mln
+2.56 mln
0.0%
jan 1, 1996
1.59 mln
-970.0K
-37.89%
jan 1, 1997
1.42 mln
-170.0K
-10.69%
jan 1, 1998
590.0K
-830.0K
-58.45%
jan 1, 1999
1.27 mln
+680.0K
115.25%
jan 1, 2000
2.03 mln
+760.0K
59.84%
jan 1, 2001
1.77 mln
-260.0K
-12.81%
jan 1, 2002
1.99 mln
+220.0K
12.43%
jan 1, 2003
2.02 mln
+30.0K
1.51%
jan 1, 2004
2.42 mln
+400.0K
19.8%
jan 1, 2005
4.12 mln
+1.7 mln
70.25%
jan 1, 2006
4.19 mln
+70.0K
1.7%
jan 1, 2007
9.4 mln
+5.21 mln
124.34%
jan 1, 2008
10.77 mln
+1.37 mln
14.57%
jan 1, 2009
27.25 mln
+16.48 mln
153.02%
jan 1, 2010
15.71 mln
-11.54 mln
-42.35%
jan 1, 2011
18.62 mln
+2.91 mln
18.52%
jan 1, 2012
19.25 mln
+630.0K
3.38%
jan 1, 2013
19.85 mln
+600.0K
3.12%
jan 1, 2014
19.69 mln
-160.0K
-0.81%
jan 1, 2015
18.46 mln
-1.23 mln
-6.25%
Ranking of countries by current statistics by years