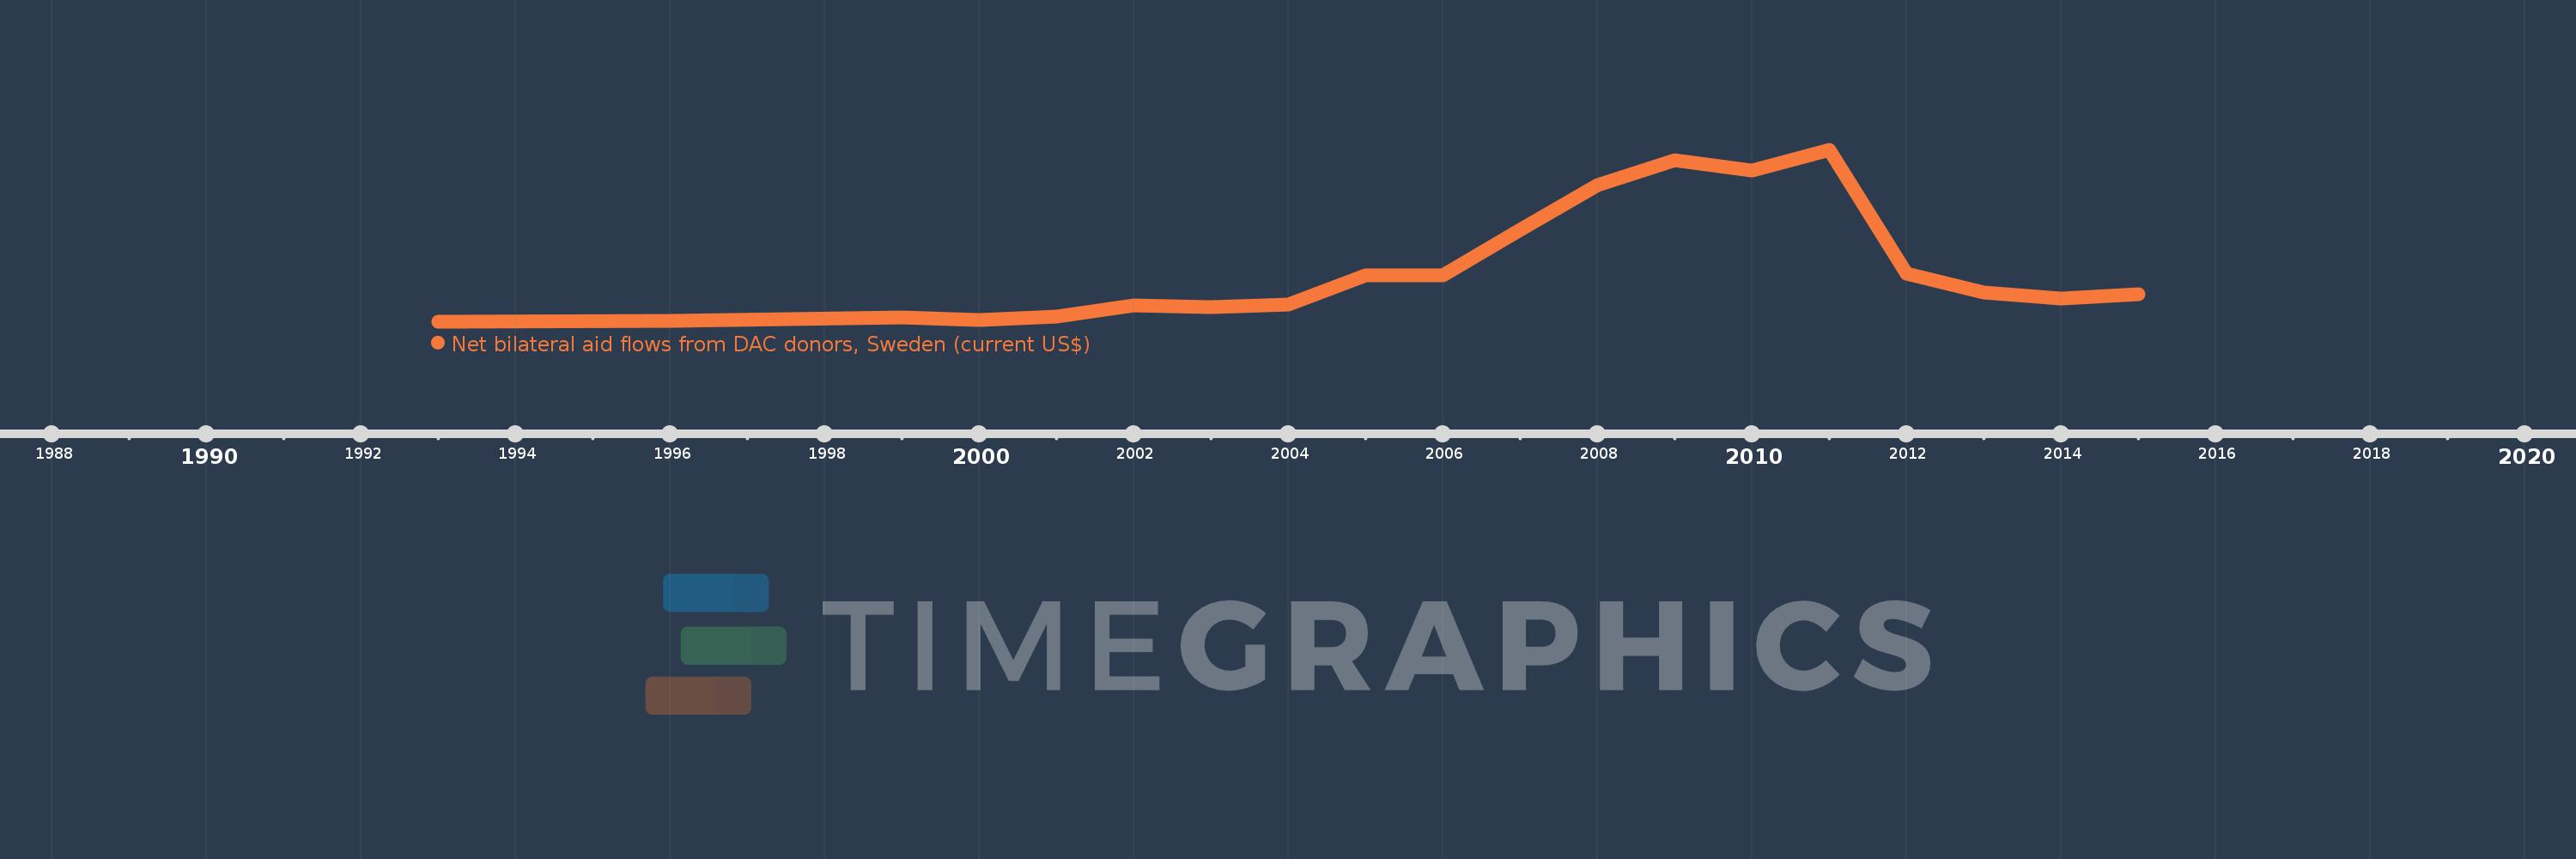
This timeline shows a graph from 1993 to 2015 of Kyrgyz Republic. No data until 1992. Number of actual observations by date: 19.
Source name:
World Development Indicators
Source organization:
Development Assistance Committee of the Organisation for Economic Co-operation and Development, Geographical Distribution of Financial Flows to Developing Countries, Development Co-operation Report, and International Development Statistics database. Data are available online at: www.oecd.org/dac/stats/idsonline.
Categories, topics:
Aid Effectiveness
Last updated:
apr 23, 2017
Indicators value changes by year
Meaning:
2.849 mln
Minimum:
20.0K
jan 1, 1993
Maximum:
9.27 mln
jan 1, 2011
At the date of observation
Value
Absolute change
Change from the previous value
jan 1, 1993
20.0K
+20.0K
0.0%
jan 1, 1996
70.0K
+50.0K
250.0%
jan 1, 1999
250.0K
+180.0K
257.14%
jan 1, 2000
120.0K
-130.0K
-52.0%
jan 1, 2001
290.0K
+170.0K
141.67%
jan 1, 2002
900.0K
+610.0K
210.34%
jan 1, 2003
840.0K
-60.0K
-6.67%
jan 1, 2004
970.0K
+130.0K
15.48%
jan 1, 2005
2.53 mln
+1.56 mln
160.82%
jan 1, 2006
2.52 mln
-10.0K
-0.4%
jan 1, 2007
4.98 mln
+2.46 mln
97.62%
jan 1, 2008
7.39 mln
+2.41 mln
48.39%
jan 1, 2009
8.74 mln
+1.35 mln
18.27%
jan 1, 2010
8.19 mln
-550.0K
-6.29%
jan 1, 2011
9.27 mln
+1.08 mln
13.19%
jan 1, 2012
2.62 mln
-6.65 mln
-71.74%
jan 1, 2013
1.62 mln
-1000.0K
-38.17%
jan 1, 2014
1.29 mln
-330.0K
-20.37%
jan 1, 2015
1.52 mln
+230.0K
17.83%
Ranking of countries by current statistics by years