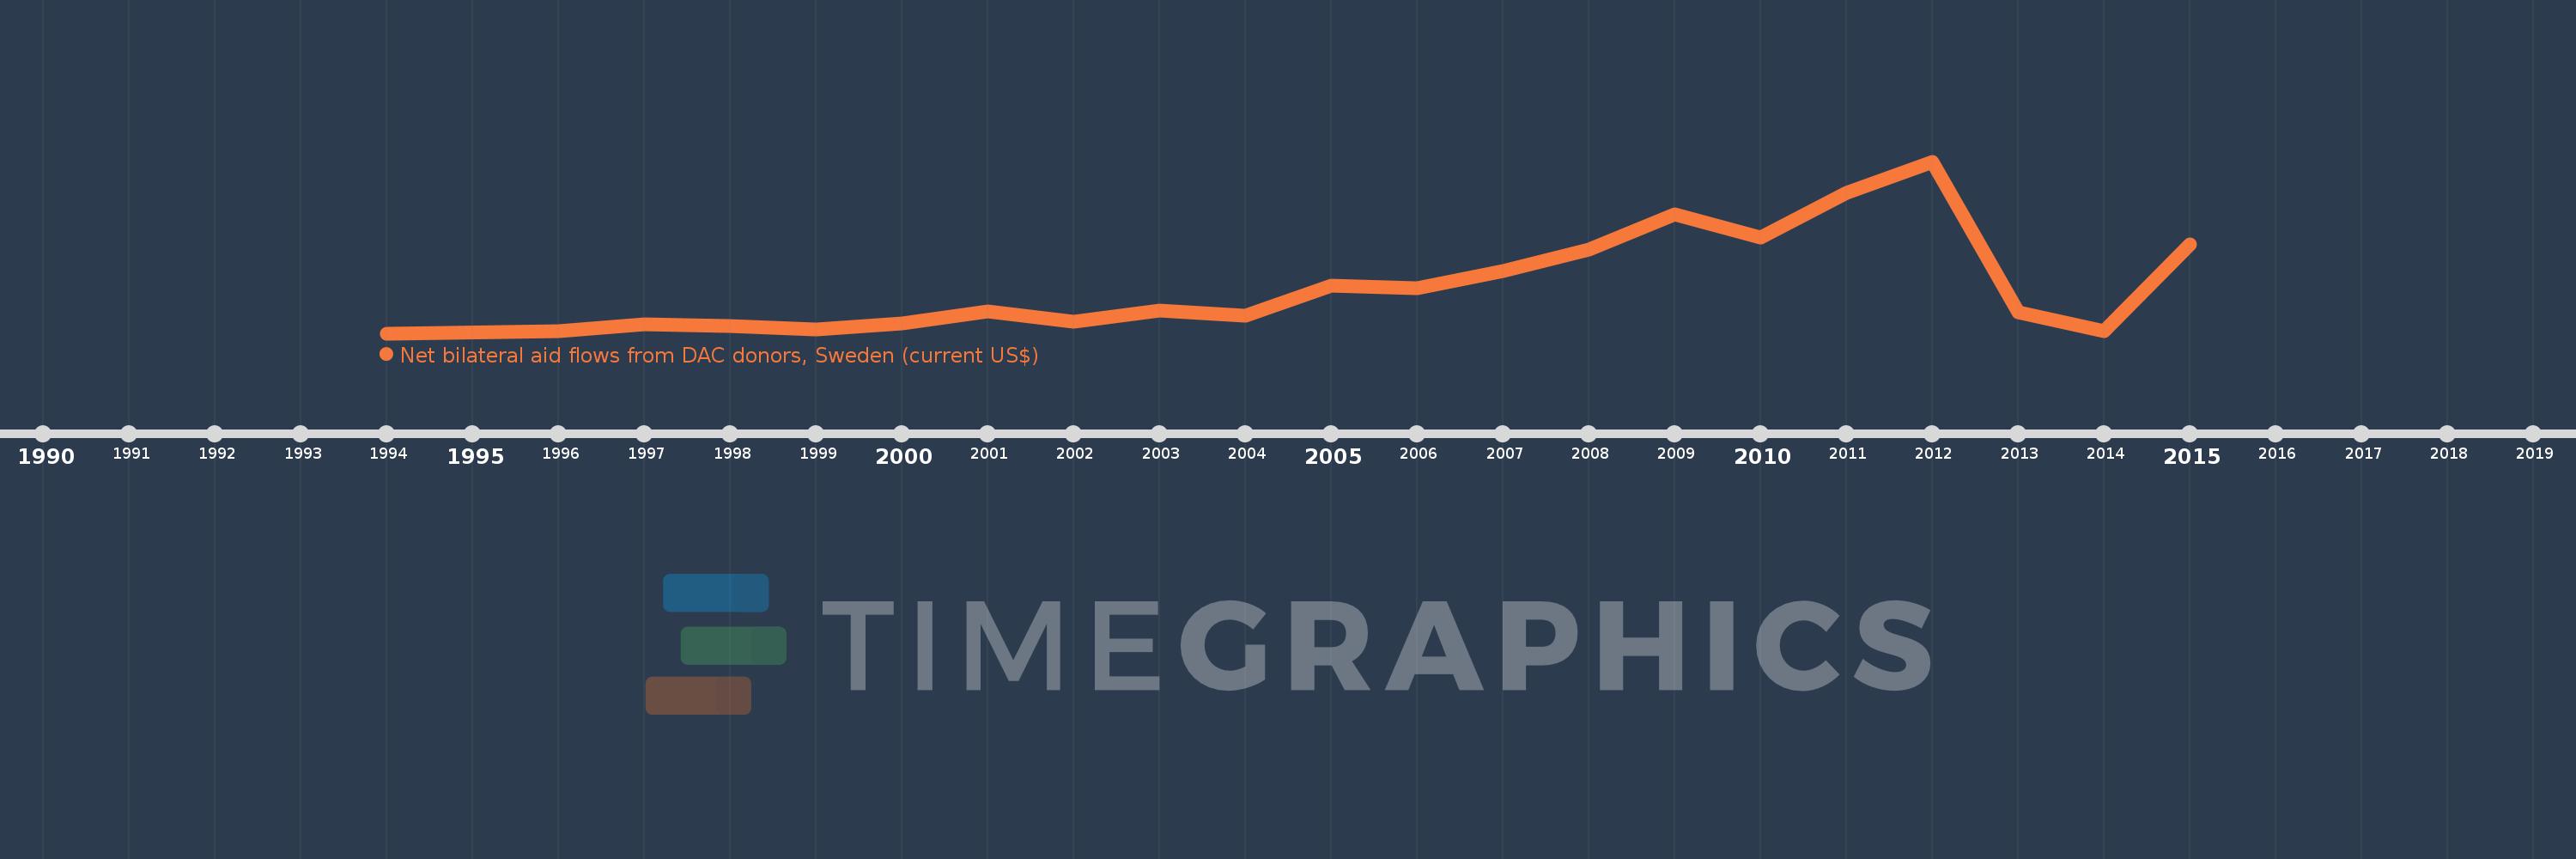
This timeline shows a graph from 1994 to 2015 of Belarus. No data until 1993. Number of actual observations by date: 21.
Source name:
World Development Indicators
Source organization:
Development Assistance Committee of the Organisation for Economic Co-operation and Development, Geographical Distribution of Financial Flows to Developing Countries, Development Co-operation Report, and International Development Statistics database. Data are available online at: www.oecd.org/dac/stats/idsonline.
Categories, topics:
Aid Effectiveness
Last updated:
apr 23, 2017
Indicators value changes by year
Meaning:
5.873 mln
Minimum:
20.0K
jan 1, 1994
Maximum:
21.46 mln
jan 1, 2012
At the date of observation
Value
Absolute change
Change from the previous value
jan 1, 1994
20.0K
+20.0K
0.0%
jan 1, 1996
290.0K
+270.0K
1.35K%
jan 1, 1997
1.17 mln
+880.0K
303.45%
jan 1, 1998
950.0K
-220.0K
-18.8%
jan 1, 1999
470.0K
-480.0K
-50.53%
jan 1, 2000
1.21 mln
+740.0K
157.45%
jan 1, 2001
2.74 mln
+1.53 mln
126.45%
jan 1, 2002
1.52 mln
-1.22 mln
-44.53%
jan 1, 2003
2.87 mln
+1.35 mln
88.82%
jan 1, 2004
2.27 mln
-600.0K
-20.91%
jan 1, 2005
6.0 mln
+3.73 mln
164.32%
jan 1, 2006
5.67 mln
-330.0K
-5.5%
jan 1, 2007
7.82 mln
+2.15 mln
37.92%
jan 1, 2008
10.45 mln
+2.63 mln
33.63%
jan 1, 2009
14.84 mln
+4.39 mln
42.01%
jan 1, 2010
11.99 mln
-2.85 mln
-19.2%
jan 1, 2011
17.5 mln
+5.51 mln
45.95%
jan 1, 2012
21.46 mln
+3.96 mln
22.63%
jan 1, 2013
2.7 mln
-18.76 mln
-87.42%
jan 1, 2014
330.0K
-2.37 mln
-87.78%
jan 1, 2015
11.07 mln
+10.74 mln
3.25K%
Ranking of countries by current statistics by years