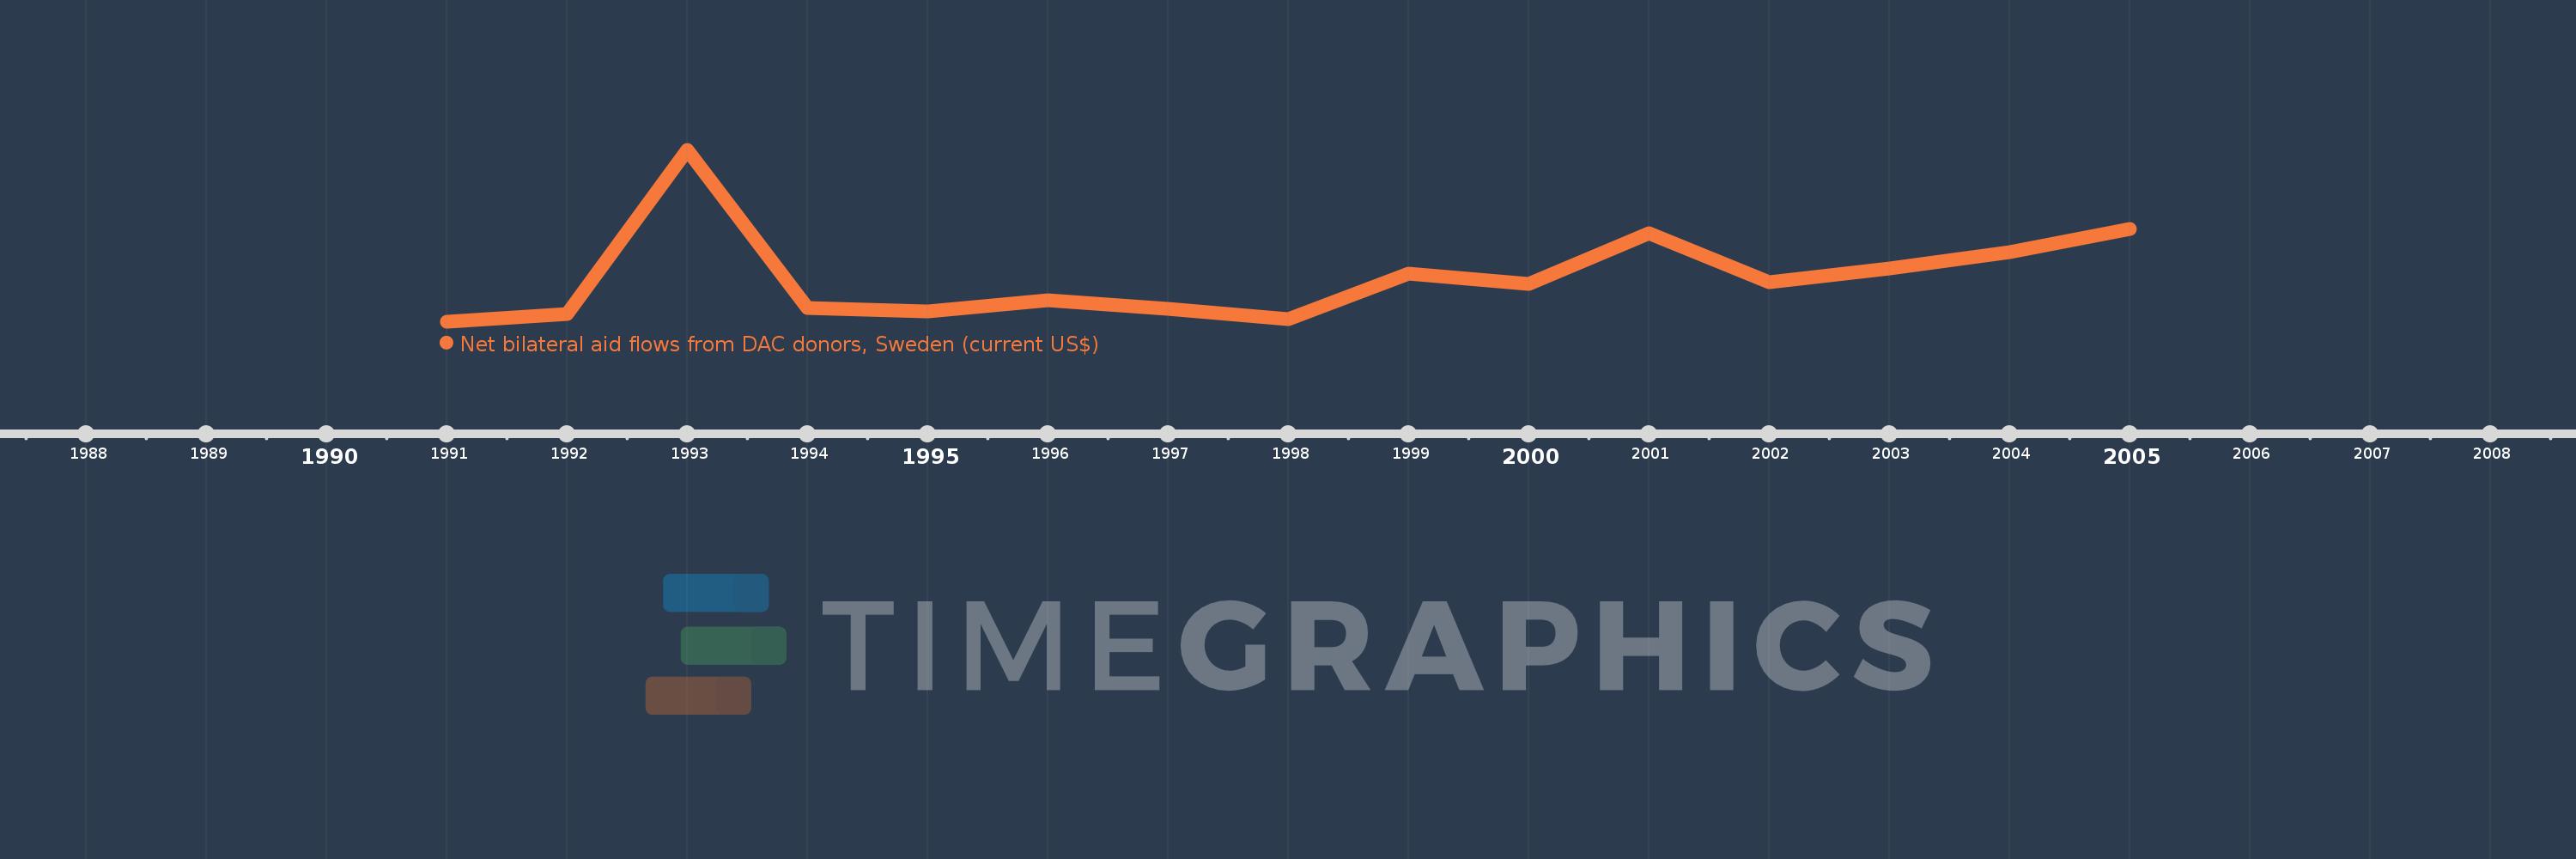
This timeline shows a graph from 1991 to 2005 of Romania. No data until 1990. Number of actual observations by date: 15.
Source name:
World Development Indicators
Source organization:
Development Assistance Committee of the Organisation for Economic Co-operation and Development, Geographical Distribution of Financial Flows to Developing Countries, Development Co-operation Report, and International Development Statistics database. Data are available online at: www.oecd.org/dac/stats/idsonline.
Categories, topics:
Aid Effectiveness
Last updated:
apr 23, 2017
Indicators value changes by year
Meaning:
504.0K
Minimum:
10.0K
jan 1, 1991
Maximum:
1.9 mln
jan 1, 1993
At the date of observation
Value
Absolute change
Change from the previous value
jan 1, 1991
10.0K
+10.0K
0.0%
jan 1, 1992
100.0K
+90.0K
900.0%
jan 1, 1993
1.9 mln
+1.8 mln
1.8K%
jan 1, 1994
160.0K
-1.74 mln
-91.58%
jan 1, 1995
130.0K
-30.0K
-18.75%
jan 1, 1996
250.0K
+120.0K
92.31%
jan 1, 1997
150.0K
-100.0K
-40.0%
jan 1, 1998
40.0K
-110.0K
-73.33%
jan 1, 1999
540.0K
+500.0K
1.25K%
jan 1, 2000
430.0K
-110.0K
-20.37%
jan 1, 2001
990.0K
+560.0K
130.23%
jan 1, 2002
450.0K
-540.0K
-54.55%
jan 1, 2003
600.0K
+150.0K
33.33%
jan 1, 2004
780.0K
+180.0K
30.0%
jan 1, 2005
1.03 mln
+250.0K
32.05%
Ranking of countries by current statistics by years