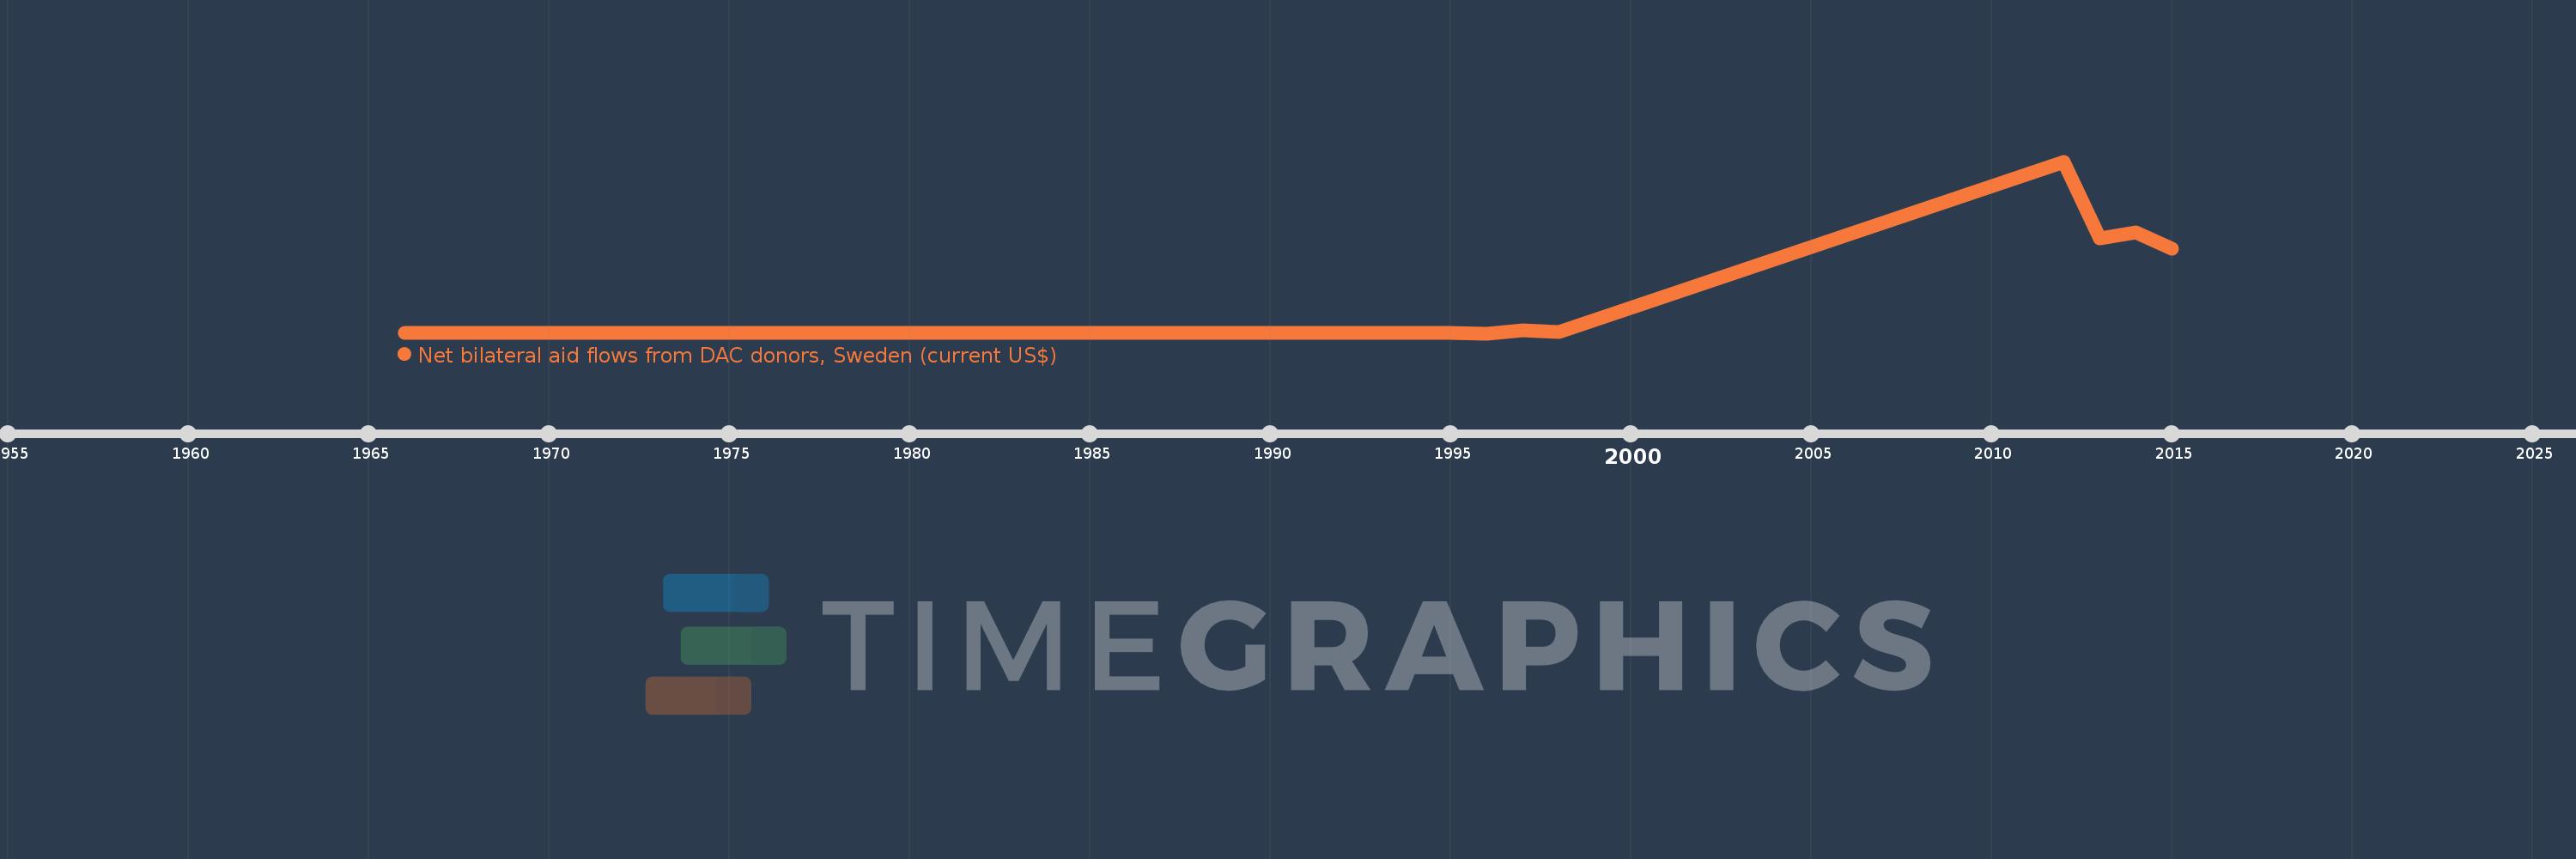
This timeline shows a graph from 1966 to 2015 of Libya. No data until 1965. Number of actual observations by date: 10.
Source name:
World Development Indicators
Source organization:
Development Assistance Committee of the Organisation for Economic Co-operation and Development, Geographical Distribution of Financial Flows to Developing Countries, Development Co-operation Report, and International Development Statistics database. Data are available online at: www.oecd.org/dac/stats/idsonline.
Categories, topics:
Aid Effectiveness
Last updated:
apr 23, 2017
Indicators value changes by year
Meaning:
3.877 mln
Minimum:
10.0K
jan 1, 1996
Maximum:
14.56 mln
jan 1, 2012
At the date of observation
Value
Absolute change
Change from the previous value
jan 1, 1966
20.0K
+20.0K
0.0%
jan 1, 1993
30.0K
+10.0K
50.0%
jan 1, 1995
20.0K
-10.0K
-33.33%
jan 1, 1996
10.0K
-10.0K
-50.0%
jan 1, 1997
240.0K
+230.0K
2.3K%
jan 1, 1998
100.0K
-140.0K
-58.33%
jan 1, 2012
14.56 mln
+14.46 mln
14.46K%
jan 1, 2013
8.03 mln
-6.53 mln
-44.85%
jan 1, 2014
8.59 mln
+560.0K
6.97%
jan 1, 2015
7.17 mln
-1.42 mln
-16.53%
Ranking of countries by current statistics by years