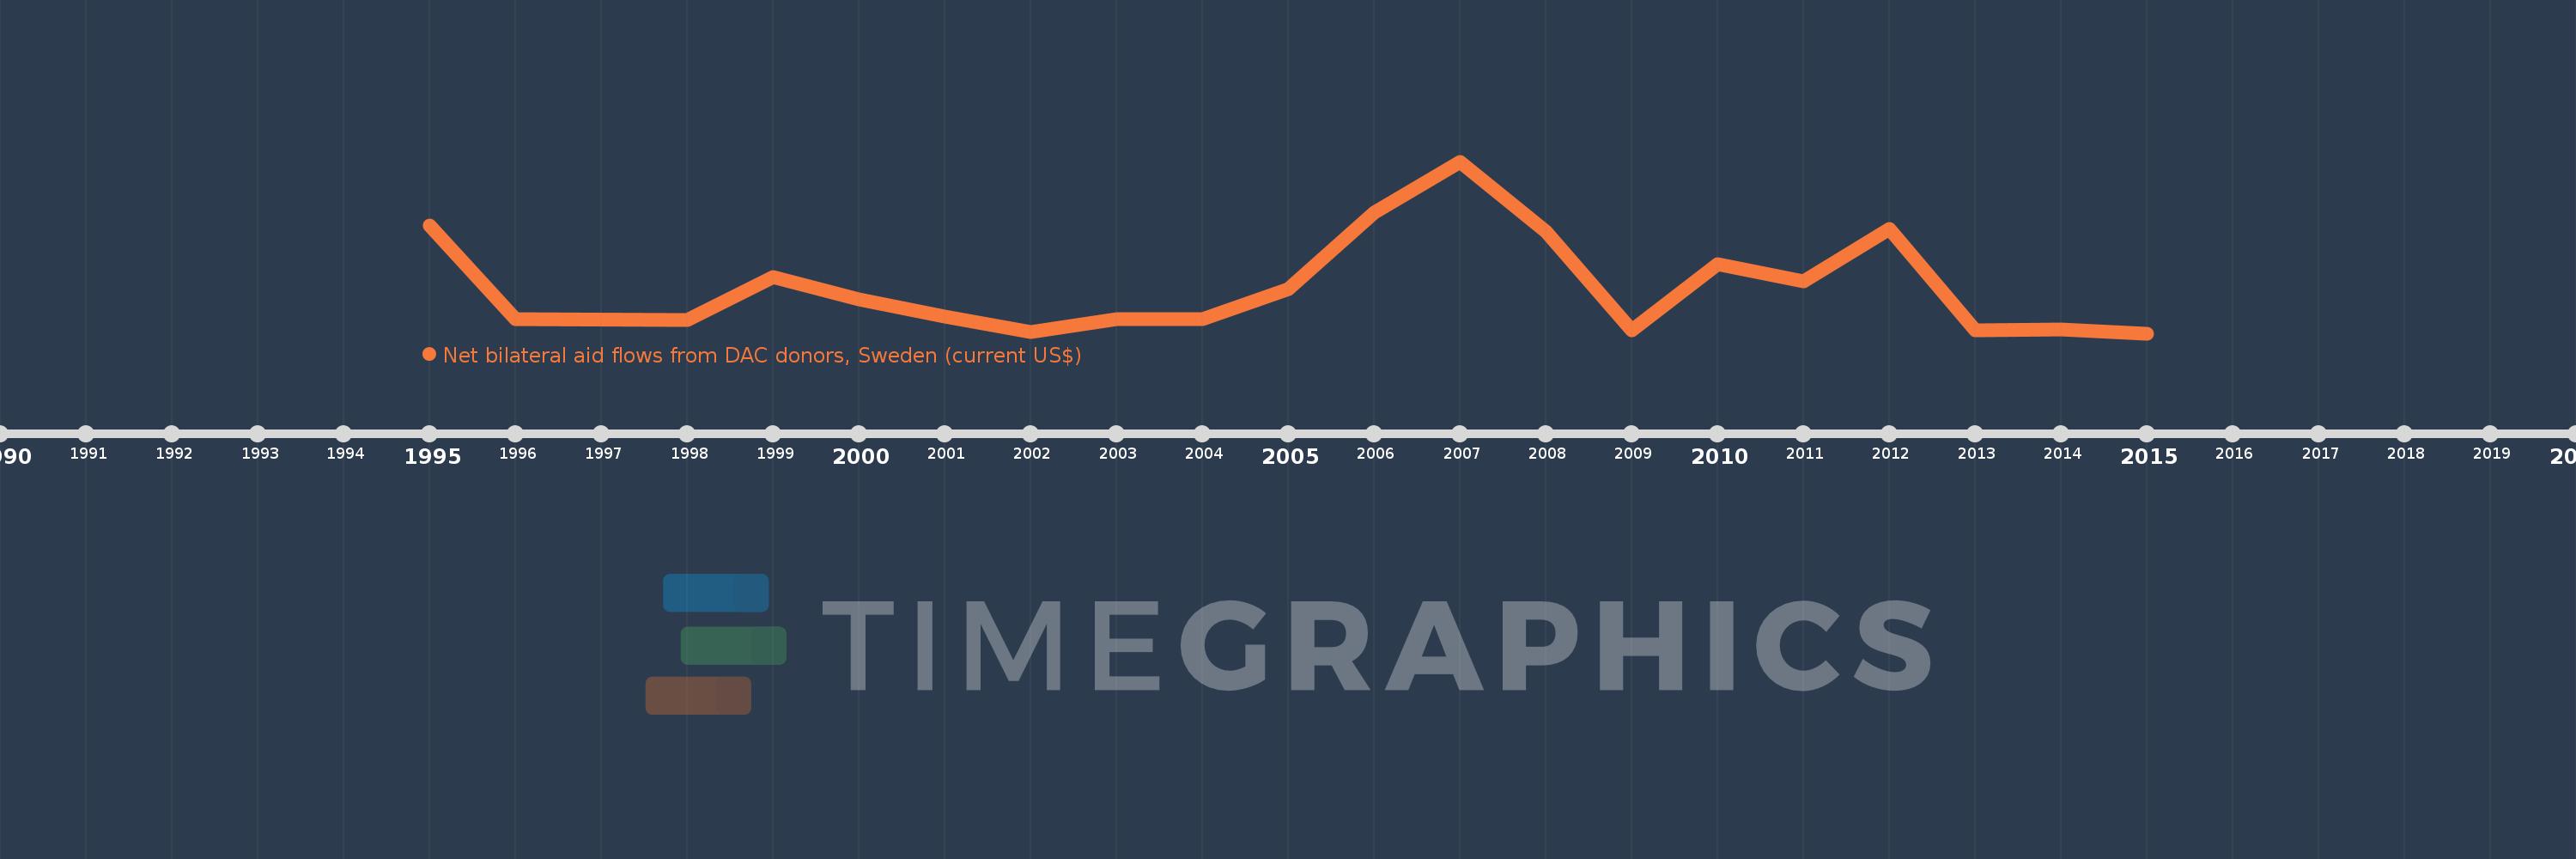
This timeline shows a graph from 1995 to 2015 of Uzbekistan. No data until 1994. Number of actual observations by date: 20.
Source name:
World Development Indicators
Source organization:
Development Assistance Committee of the Organisation for Economic Co-operation and Development, Geographical Distribution of Financial Flows to Developing Countries, Development Co-operation Report, and International Development Statistics database. Data are available online at: www.oecd.org/dac/stats/idsonline.
Categories, topics:
Aid Effectiveness
Last updated:
apr 23, 2017
Indicators value changes by year
Meaning:
393.0K
Minimum:
30.0K
jan 1, 2015
Maximum:
1.35 mln
jan 1, 2007
At the date of observation
Value
Absolute change
Change from the previous value
jan 1, 1995
860.0K
+860.0K
0.0%
jan 1, 1996
140.0K
-720.0K
-83.72%
jan 1, 1998
130.0K
-10.0K
-7.14%
jan 1, 1999
460.0K
+330.0K
253.85%
jan 1, 2000
290.0K
-170.0K
-36.96%
jan 1, 2001
160.0K
-130.0K
-44.83%
jan 1, 2002
40.0K
-120.0K
-75.0%
jan 1, 2003
140.0K
+100.0K
250.0%
jan 1, 2004
140.0K
0.0
0.0%
jan 1, 2005
370.0K
+230.0K
164.29%
jan 1, 2006
960.0K
+590.0K
159.46%
jan 1, 2007
1.35 mln
+390.0K
40.63%
jan 1, 2008
810.0K
-540.0K
-40.0%
jan 1, 2009
50.0K
-760.0K
-93.83%
jan 1, 2010
560.0K
+510.0K
1.02K%
jan 1, 2011
430.0K
-130.0K
-23.21%
jan 1, 2012
830.0K
+400.0K
93.02%
jan 1, 2013
50.0K
-780.0K
-93.98%
jan 1, 2014
60.0K
+10.0K
20.0%
jan 1, 2015
30.0K
-30.0K
-50.0%
Ranking of countries by current statistics by years