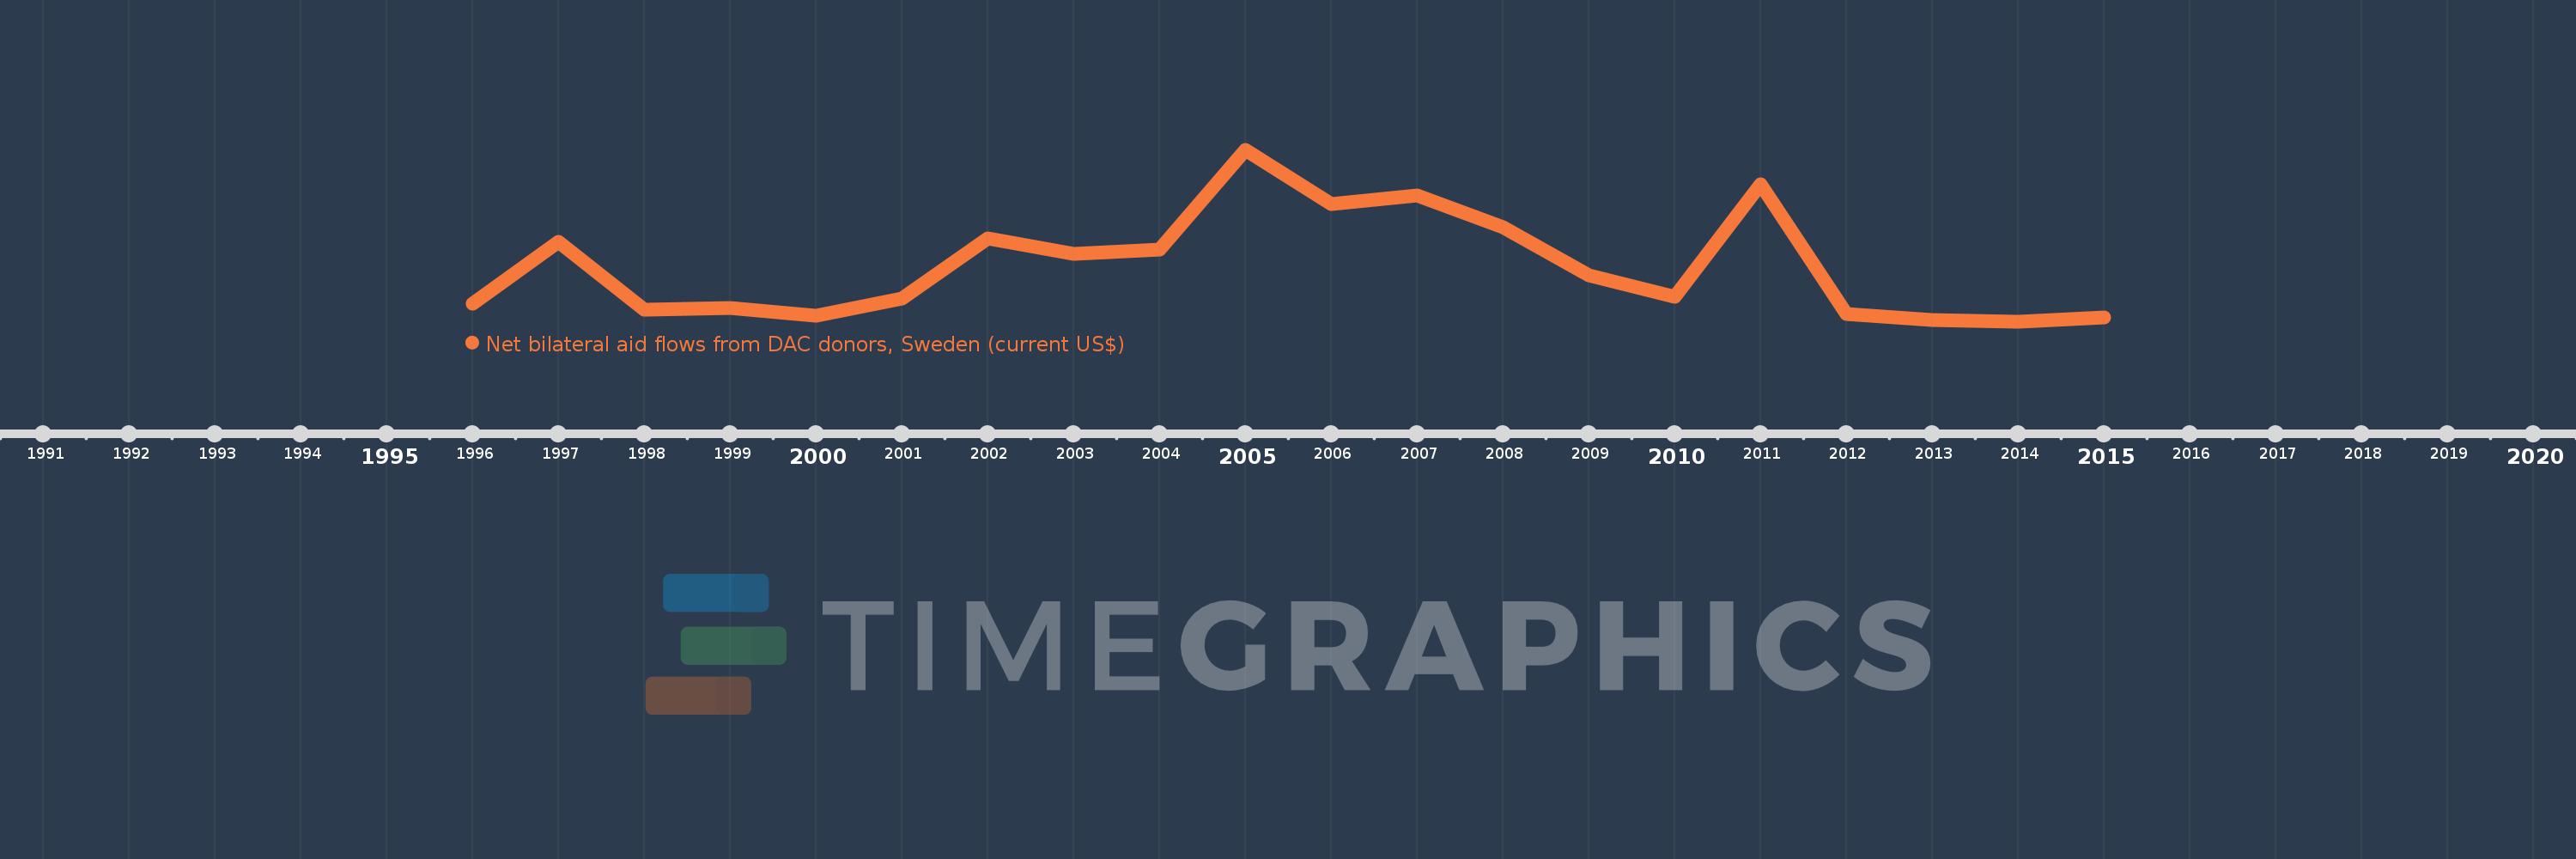
This timeline shows a graph from 1996 to 2015 of Kazakhstan. No data until 1995. Number of actual observations by date: 20.
Source name:
World Development Indicators
Source organization:
Development Assistance Committee of the Organisation for Economic Co-operation and Development, Geographical Distribution of Financial Flows to Developing Countries, Development Co-operation Report, and International Development Statistics database. Data are available online at: www.oecd.org/dac/stats/idsonline.
Categories, topics:
Aid Effectiveness
Last updated:
apr 23, 2017
Indicators value changes by year
Meaning:
399.5K
Minimum:
40.0K
jan 1, 2014
Maximum:
1.15 mln
jan 1, 2005
At the date of observation
Value
Absolute change
Change from the previous value
jan 1, 1996
160.0K
+160.0K
0.0%
jan 1, 1997
560.0K
+400.0K
250.0%
jan 1, 1998
120.0K
-440.0K
-78.57%
jan 1, 1999
130.0K
+10.0K
8.33%
jan 1, 2000
80.0K
-50.0K
-38.46%
jan 1, 2001
190.0K
+110.0K
137.5%
jan 1, 2002
580.0K
+390.0K
205.26%
jan 1, 2003
480.0K
-100.0K
-17.24%
jan 1, 2004
510.0K
+30.0K
6.25%
jan 1, 2005
1.15 mln
+640.0K
125.49%
jan 1, 2006
800.0K
-350.0K
-30.43%
jan 1, 2007
860.0K
+60.0K
7.5%
jan 1, 2008
650.0K
-210.0K
-24.42%
jan 1, 2009
340.0K
-310.0K
-47.69%
jan 1, 2010
200.0K
-140.0K
-41.18%
jan 1, 2011
930.0K
+730.0K
365.0%
jan 1, 2012
90.0K
-840.0K
-90.32%
jan 1, 2013
50.0K
-40.0K
-44.44%
jan 1, 2014
40.0K
-10.0K
-20.0%
jan 1, 2015
70.0K
+30.0K
75.0%
Ranking of countries by current statistics by years