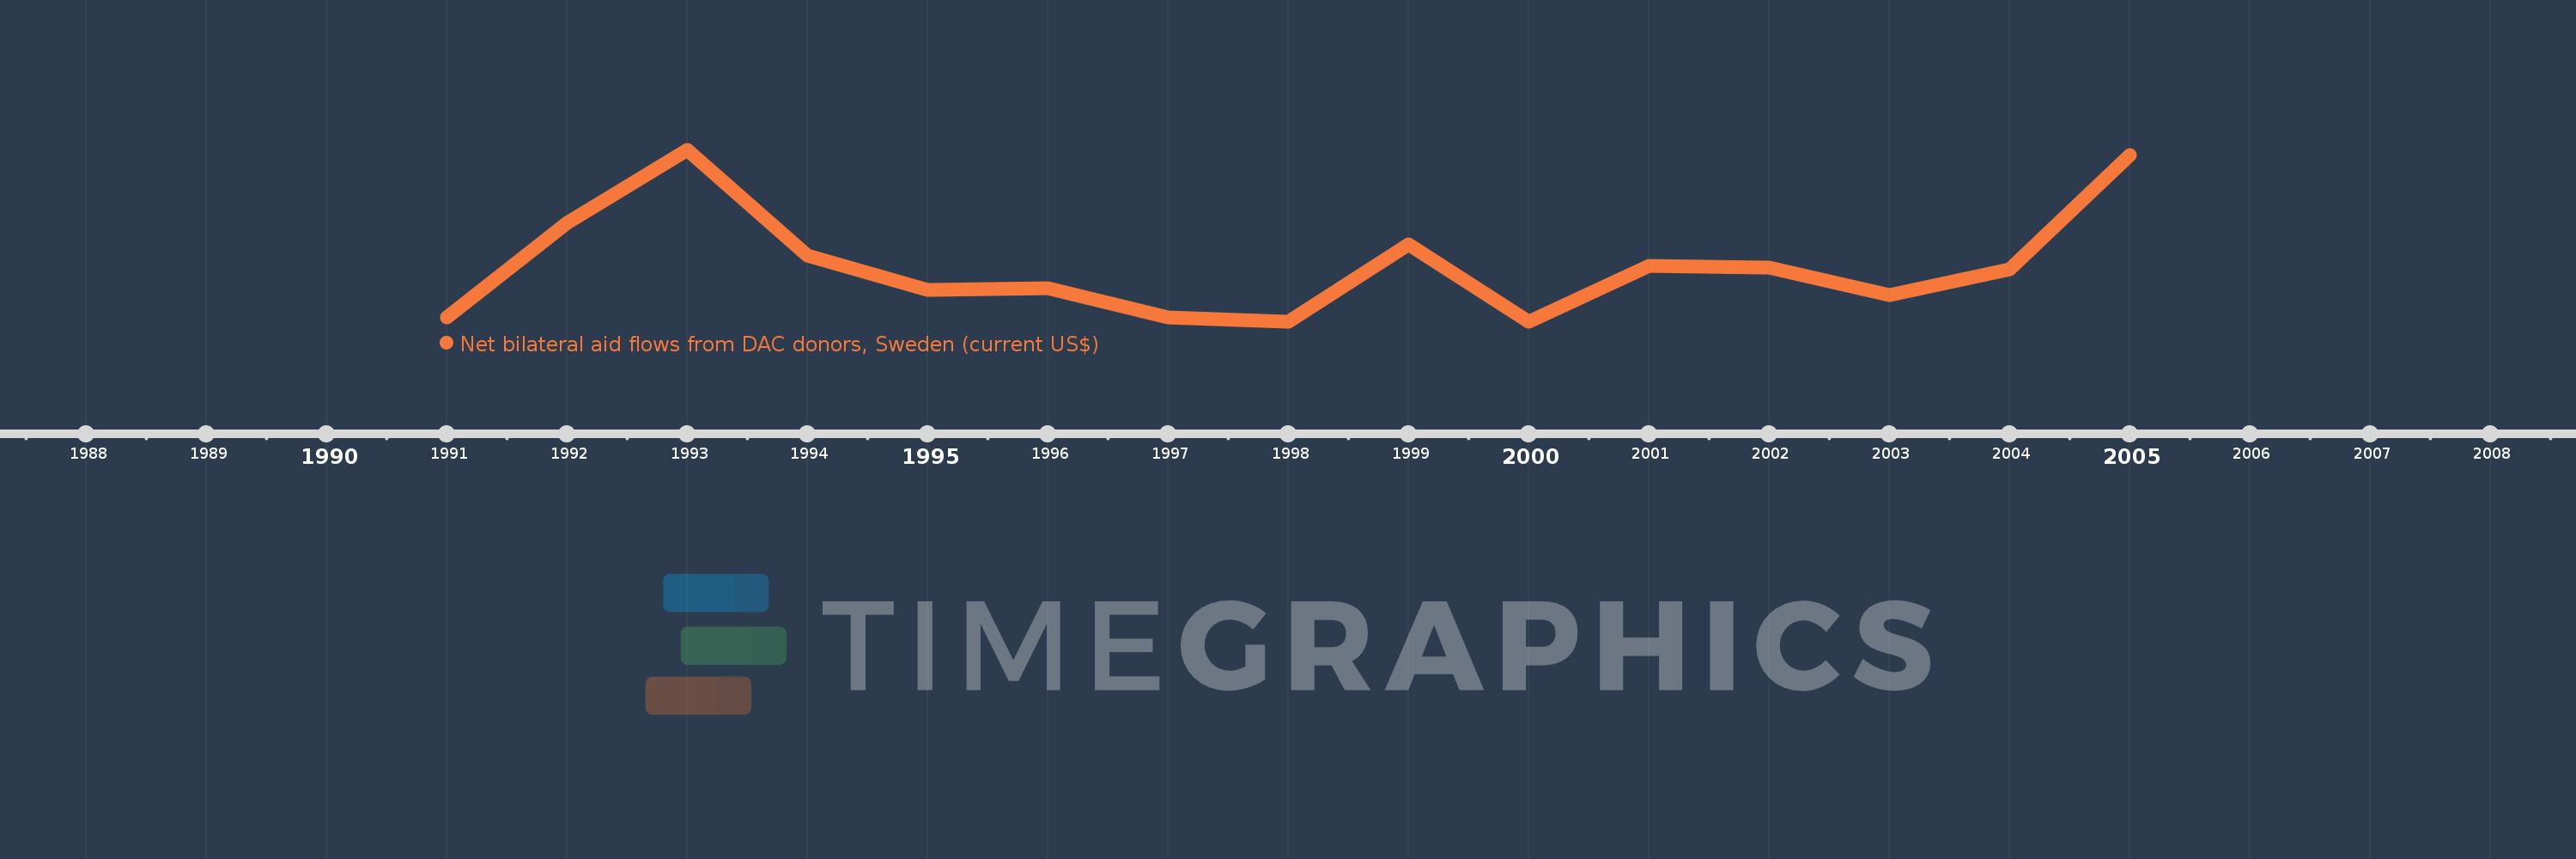
This timeline shows a graph from 1991 to 2005 of Hungary. No data until 1990. Number of actual observations by date: 15.
Source name:
World Development Indicators
Source organization:
Development Assistance Committee of the Organisation for Economic Co-operation and Development, Geographical Distribution of Financial Flows to Developing Countries, Development Co-operation Report, and International Development Statistics database. Data are available online at: www.oecd.org/dac/stats/idsonline.
Categories, topics:
Aid Effectiveness
Last updated:
apr 23, 2017
Indicators value changes by year
Meaning:
374.667K
Minimum:
20.0K
jan 1, 1998
Maximum:
1.1 mln
jan 1, 1993
At the date of observation
Value
Absolute change
Change from the previous value
jan 1, 1991
50.0K
+50.0K
0.0%
jan 1, 1992
640.0K
+590.0K
1.18K%
jan 1, 1993
1.1 mln
+460.0K
71.88%
jan 1, 1994
440.0K
-660.0K
-60.0%
jan 1, 1995
220.0K
-220.0K
-50.0%
jan 1, 1996
230.0K
+10.0K
4.55%
jan 1, 1997
50.0K
-180.0K
-78.26%
jan 1, 1998
20.0K
-30.0K
-60.0%
jan 1, 1999
510.0K
+490.0K
2.45K%
jan 1, 2000
20.0K
-490.0K
-96.08%
jan 1, 2001
370.0K
+350.0K
1.75K%
jan 1, 2002
360.0K
-10.0K
-2.7%
jan 1, 2003
190.0K
-170.0K
-47.22%
jan 1, 2004
350.0K
+160.0K
84.21%
jan 1, 2005
1.07 mln
+720.0K
205.71%
Ranking of countries by current statistics by years