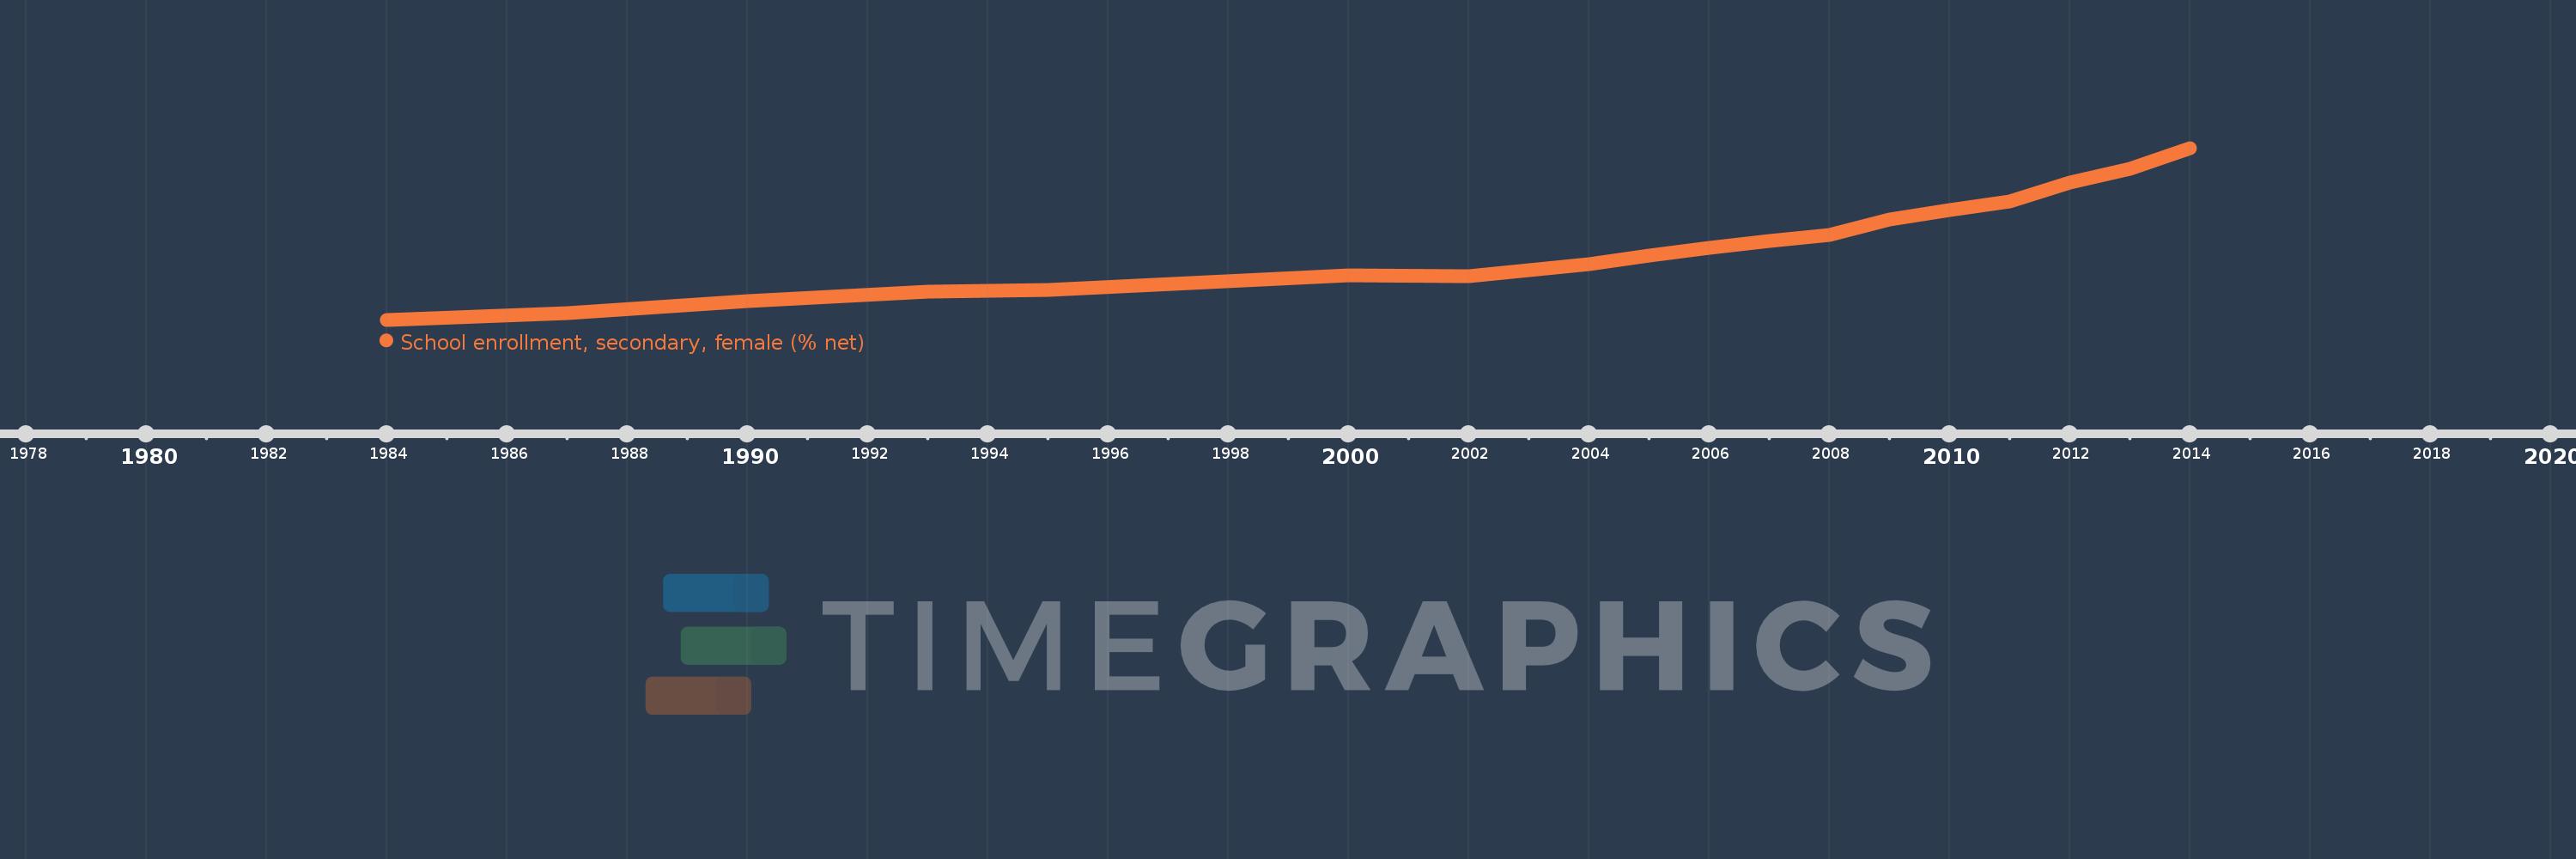
Questa scala temporale mostra un grafico dal 1984 anno al 2014 anno. Burkina Faso. I dati fino ad 1983 anno non disponibili. Il numero di osservazioni attuali secondo i date: 19.
La fonte (nome):
Indicatori dello sviluppo mondiale
La fonte (organizzazione):
United Nations Educational, Scientific, and Cultural Organization (UNESCO) Institute for Statistics.
Categorie:
Education, Gender
sono stati aggiornati
23 apr 2017 anni
Indicatori delle variazioni dei valori per anni
In media:
9.276
Minima:
1.673
1 gen 1984 anni
Massimo:
20.159
1 gen 2014 anni
Alla data di osservazione
Valore
Variazione assoluta
La variazione rispetto al valore precedente
1 gen 1984 anni
1.673
+1.673
0.0%
1 gen 1987 anni
2.397
+0.724
43.28%
1 gen 1990 anni
3.634
+1.237
51.62%
1 gen 1993 anni
4.651
+1.017
27.99%
1 gen 1994 anni
4.781
+0.129
2.78%
1 gen 1995 anni
4.915
+0.134
2.81%
1 gen 2000 anni
6.444
+1.529
31.12%
1 gen 2002 anni
6.326
-0.118
-1.83%
1 gen 2004 anni
7.679
+1.352
21.38%
1 gen 2005 anni
8.567
+0.888
11.57%
1 gen 2006 anni
9.419
+0.852
9.94%
1 gen 2007 anni
10.153
+0.734
7.79%
1 gen 2008 anni
10.815
+0.662
6.52%
1 gen 2009 anni
12.5
+1.685
15.58%
1 gen 2010 anni
13.439
+0.939
7.51%
1 gen 2011 anni
14.391
+0.952
7.08%
1 gen 2012 anni
16.401
+2.01
13.97%
1 gen 2013 anni
17.896
+1.495
9.11%
1 gen 2014 anni
20.159
+2.263
12.64%
Classificazione dei paesi secondo i statistiche attuali per anni