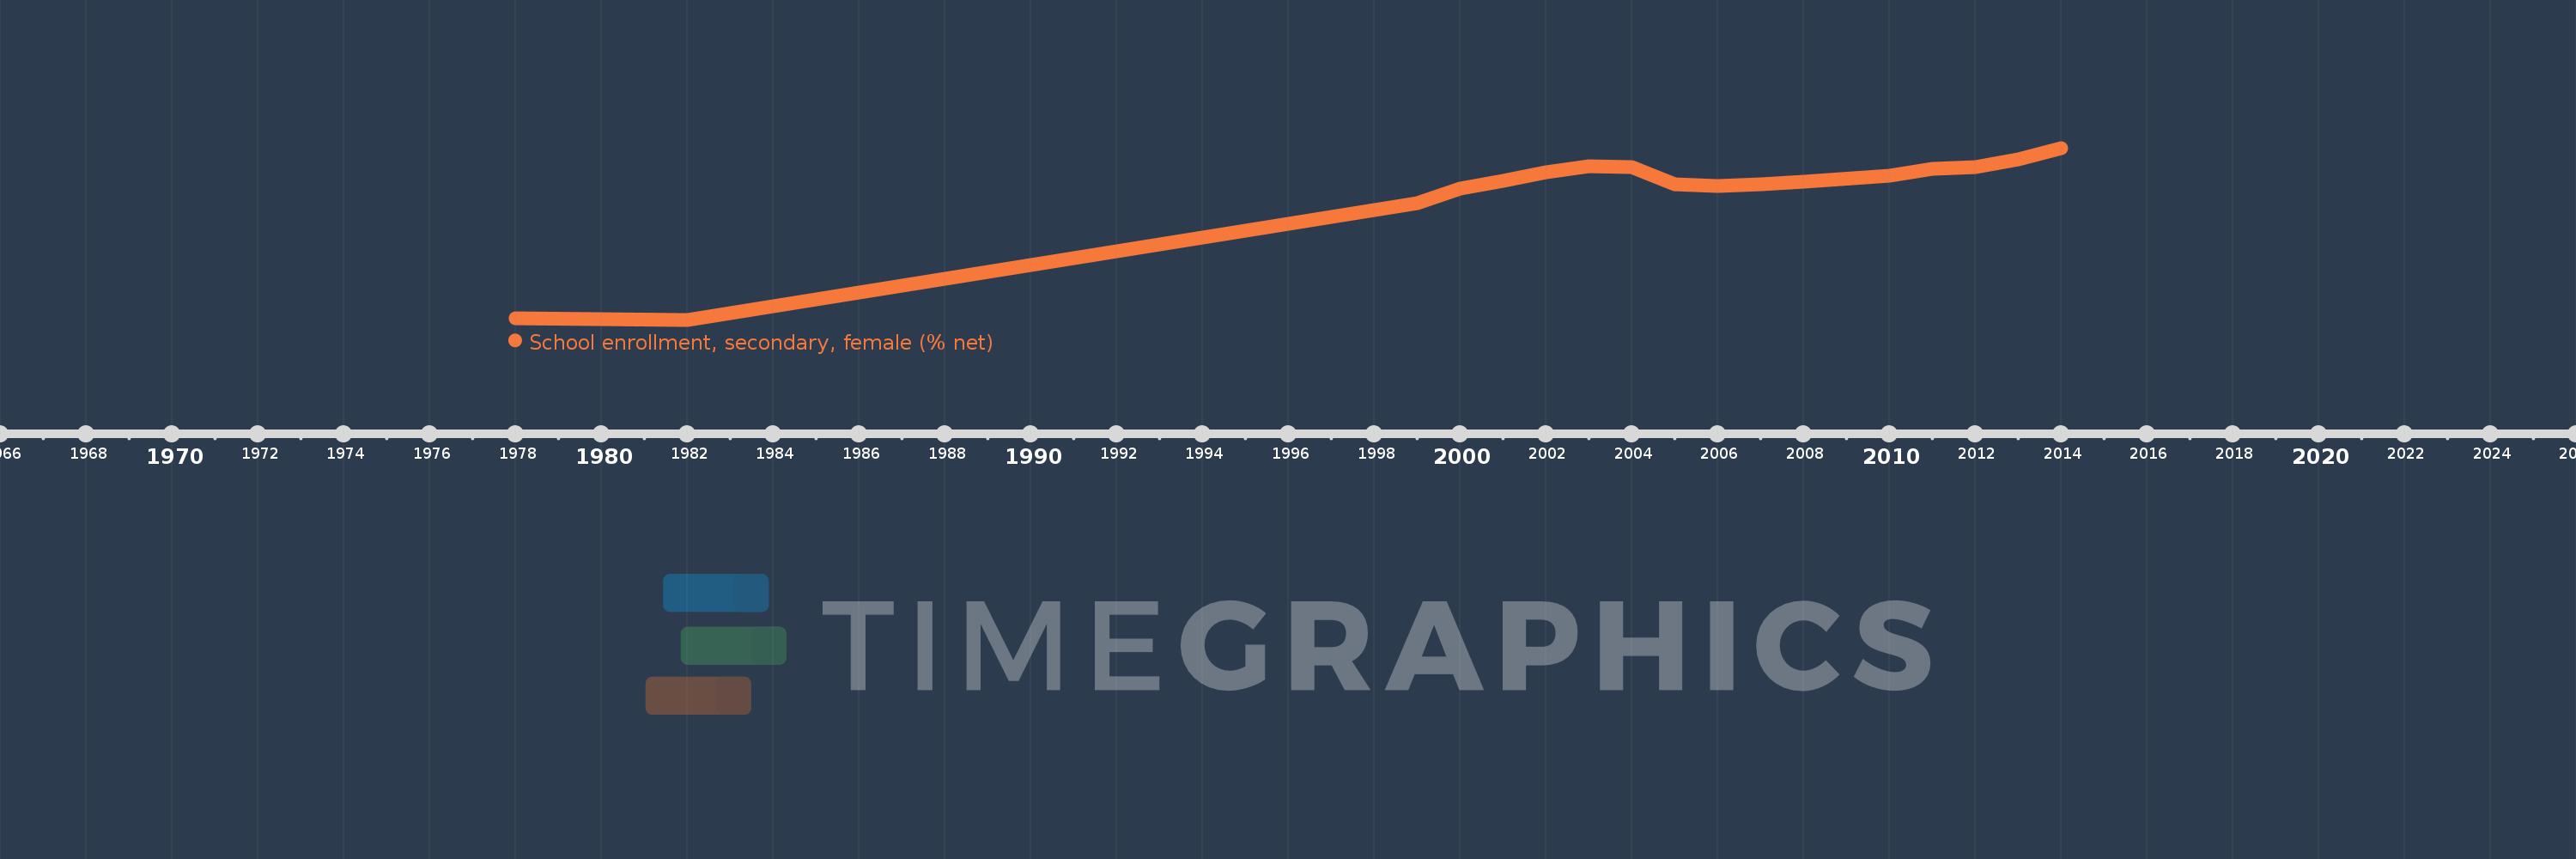
Questa scala temporale mostra un grafico dal 1978 anno al 2014 anno. Bangladesh. I dati fino ad 1977 anno non disponibili. Il numero di osservazioni attuali secondo i date: 17.
La fonte (nome):
Indicatori dello sviluppo mondiale
La fonte (organizzazione):
United Nations Educational, Scientific, and Cultural Organization (UNESCO) Institute for Statistics.
Categorie:
Education, Gender
sono stati aggiornati
23 apr 2017 anni
Indicatori delle variazioni dei valori per anni
In media:
42.179
Minima:
6.018
1 gen 1982 anni
Massimo:
54.789
1 gen 2014 anni
Alla data di osservazione
Valore
Variazione assoluta
La variazione rispetto al valore precedente
1 gen 1978 anni
6.332
+6.332
0.0%
1 gen 1982 anni
6.018
-0.314
-4.96%
1 gen 1999 anni
39.203
+33.185
551.46%
1 gen 2000 anni
43.321
+4.118
10.5%
1 gen 2001 anni
45.512
+2.191
5.06%
1 gen 2002 anni
47.946
+2.434
5.35%
1 gen 2003 anni
49.515
+1.569
3.27%
1 gen 2004 anni
49.424
-0.091
-0.18%
1 gen 2005 anni
44.514
-4.91
-9.93%
1 gen 2006 anni
44.032
-0.482
-1.08%
1 gen 2007 anni
44.53
+0.498
1.13%
1 gen 2008 anni
45.268
+0.738
1.66%
1 gen 2010 anni
46.856
+1.587
3.51%
1 gen 2011 anni
48.947
+2.092
4.46%
1 gen 2012 anni
49.325
+0.377
0.77%
1 gen 2013 anni
51.517
+2.193
4.45%
1 gen 2014 anni
54.789
+3.272
6.35%
Classificazione dei paesi secondo i statistiche attuali per anni