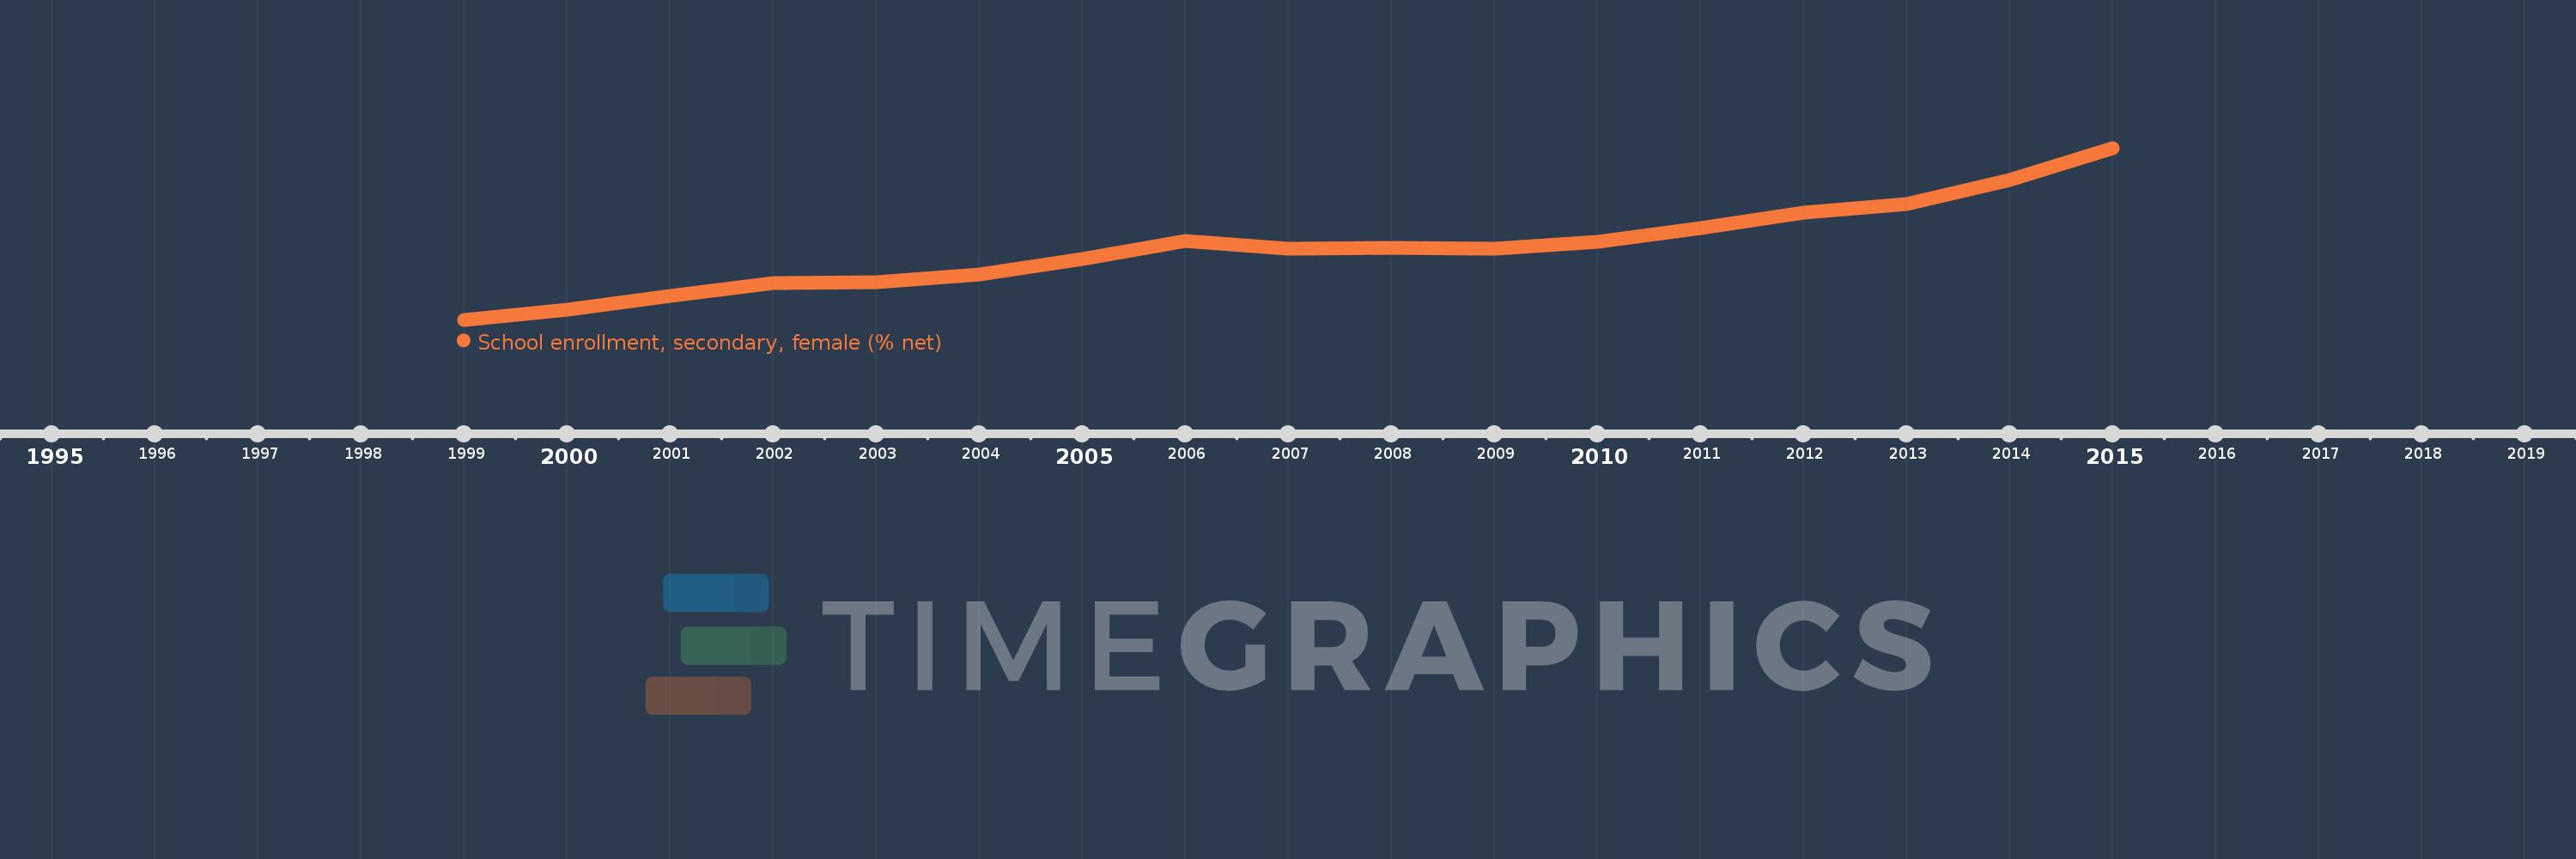
Questa scala temporale mostra un grafico dal 1999 anno al 2015 anno. Late-demographic dividend. I dati fino ad 1998 anno non disponibili. Il numero di osservazioni attuali secondo i date: 17.
La fonte (nome):
Indicatori dello sviluppo mondiale
La fonte (organizzazione):
United Nations Educational, Scientific, and Cultural Organization (UNESCO) Institute for Statistics.
Categorie:
Education, Gender
sono stati aggiornati
23 apr 2017 anni
Indicatori delle variazioni dei valori per anni
In media:
73.92
Minima:
68.105
1 gen 1999 anni
Massimo:
82.122
1 gen 2015 anni
Alla data di osservazione
Valore
Variazione assoluta
La variazione rispetto al valore precedente
1 gen 1999 anni
68.105
+68.105
0.0%
1 gen 2000 anni
68.952
+0.846
1.24%
1 gen 2001 anni
70.019
+1.068
1.55%
1 gen 2002 anni
71.087
+1.067
1.52%
1 gen 2003 anni
71.174
+0.087
0.12%
1 gen 2004 anni
71.804
+0.631
0.89%
1 gen 2005 anni
73.045
+1.24
1.73%
1 gen 2006 anni
74.499
+1.455
1.99%
1 gen 2007 anni
73.877
-0.623
-0.84%
1 gen 2008 anni
73.996
+0.119
0.16%
1 gen 2009 anni
73.905
-0.091
-0.12%
1 gen 2010 anni
74.477
+0.572
0.77%
1 gen 2011 anni
75.616
+1.139
1.53%
1 gen 2012 anni
76.876
+1.259
1.67%
1 gen 2013 anni
77.567
+0.691
0.9%
1 gen 2014 anni
79.517
+1.95
2.51%
1 gen 2015 anni
82.122
+2.605
3.28%
Classificazione dei paesi secondo i statistiche attuali per anni