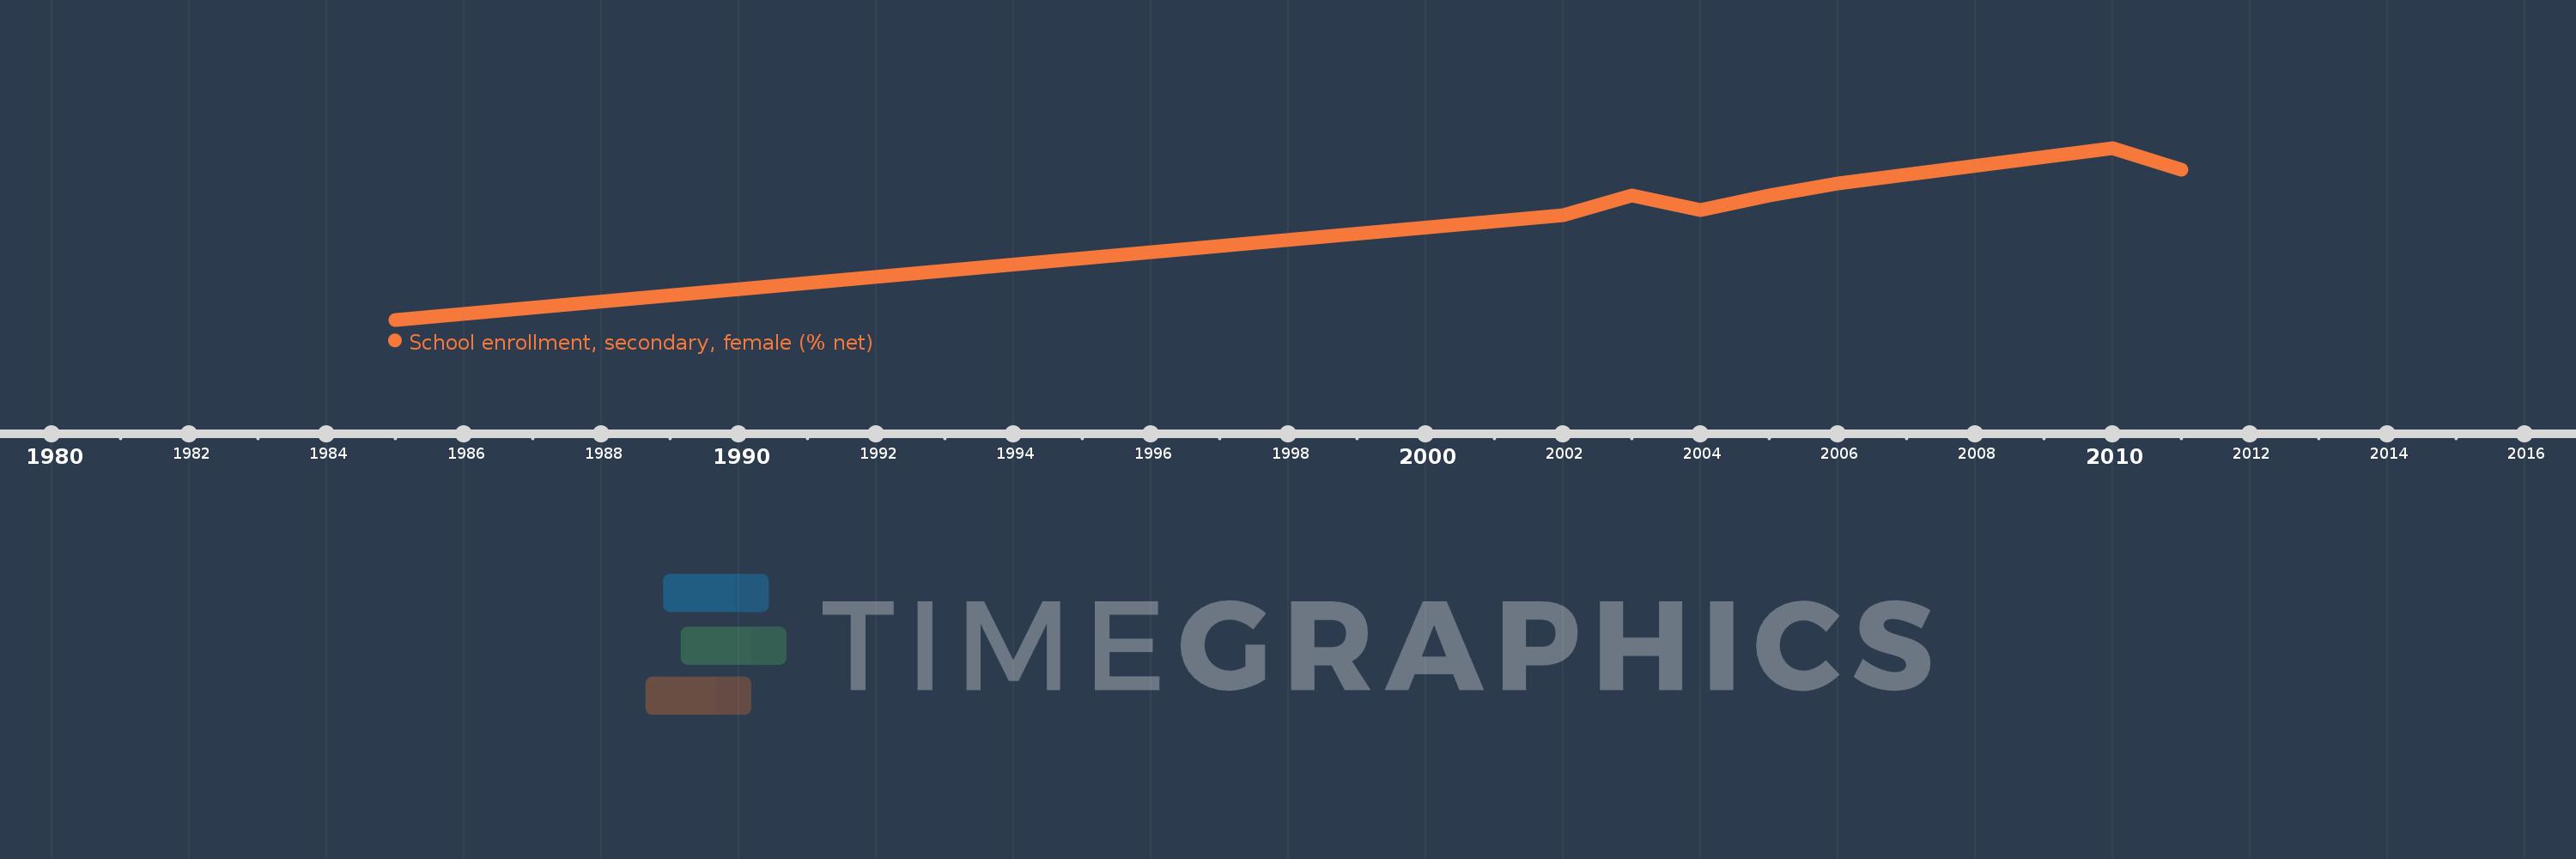
Questa scala temporale mostra un grafico dal 1985 anno al 2011 anno. St. Vincent and the Grenadines. I dati fino ad 1984 anno non disponibili. Il numero di osservazioni attuali secondo i date: 8.
La fonte (nome):
Indicatori dello sviluppo mondiale
La fonte (organizzazione):
United Nations Educational, Scientific, and Cultural Organization (UNESCO) Institute for Statistics.
Categorie:
Education, Gender
sono stati aggiornati
23 apr 2017 anni
Indicatori delle variazioni dei valori per anni
In media:
76.504
Minima:
43.794
1 gen 1985 anni
Massimo:
92.572
1 gen 2010 anni
Alla data di osservazione
Valore
Variazione assoluta
La variazione rispetto al valore precedente
1 gen 1985 anni
43.794
+43.794
0.0%
1 gen 2002 anni
73.361
+29.567
67.51%
1 gen 2003 anni
79.167
+5.805
7.91%
1 gen 2004 anni
75.014
-4.153
-5.25%
1 gen 2005 anni
79.199
+4.186
5.58%
1 gen 2006 anni
82.411
+3.212
4.06%
1 gen 2010 anni
92.572
+10.161
12.33%
1 gen 2011 anni
86.516
-6.056
-6.54%
Classificazione dei paesi secondo i statistiche attuali per anni