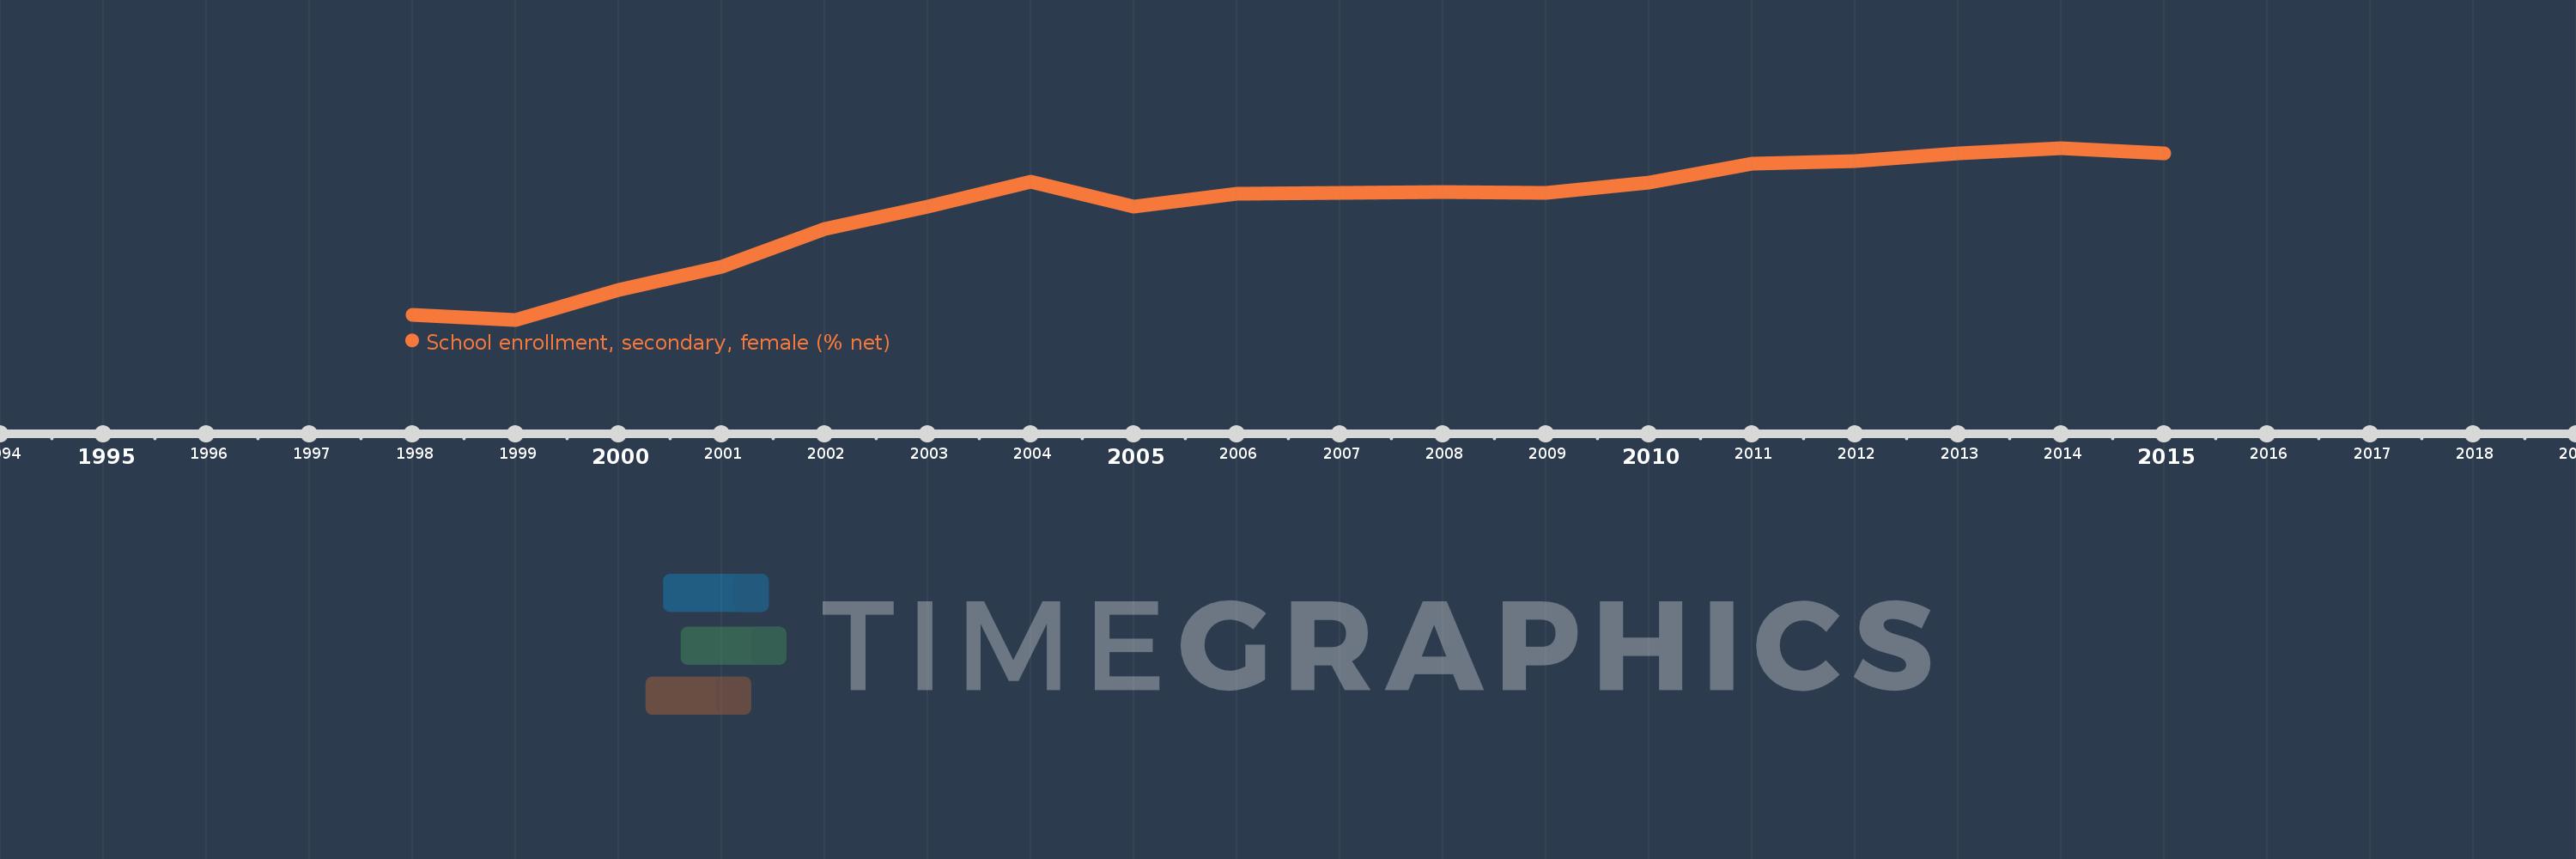
Questa scala temporale mostra un grafico dal 1998 anno al 2015 anno. Hungary. I dati fino ad 1997 anno non disponibili. Il numero di osservazioni attuali secondo i date: 18.
La fonte (nome):
Indicatori dello sviluppo mondiale
La fonte (organizzazione):
United Nations Educational, Scientific, and Cultural Organization (UNESCO) Institute for Statistics.
Categorie:
Education, Gender
sono stati aggiornati
23 apr 2017 anni
Indicatori delle variazioni dei valori per anni
In media:
88.896
Minima:
82.308
1 gen 1999 anni
Massimo:
92.455
1 gen 2014 anni
Alla data di osservazione
Valore
Variazione assoluta
La variazione rispetto al valore precedente
1 gen 1998 anni
82.622
+82.622
0.0%
1 gen 1999 anni
82.308
-0.314
-0.38%
1 gen 2000 anni
84.044
+1.735
2.11%
1 gen 2001 anni
85.429
+1.385
1.65%
1 gen 2002 anni
87.661
+2.232
2.61%
1 gen 2003 anni
89.011
+1.35
1.54%
1 gen 2004 anni
90.468
+1.458
1.64%
1 gen 2005 anni
88.984
-1.484
-1.64%
1 gen 2006 anni
89.768
+0.784
0.88%
1 gen 2007 anni
89.816
+0.049
0.05%
1 gen 2008 anni
89.866
+0.05
0.06%
1 gen 2009 anni
89.798
-0.068
-0.08%
1 gen 2010 anni
90.421
+0.624
0.69%
1 gen 2011 anni
91.529
+1.107
1.22%
1 gen 2012 anni
91.7
+0.171
0.19%
1 gen 2013 anni
92.125
+0.426
0.46%
1 gen 2014 anni
92.455
+0.33
0.36%
1 gen 2015 anni
92.125
-0.331
-0.36%
Classificazione dei paesi secondo i statistiche attuali per anni